
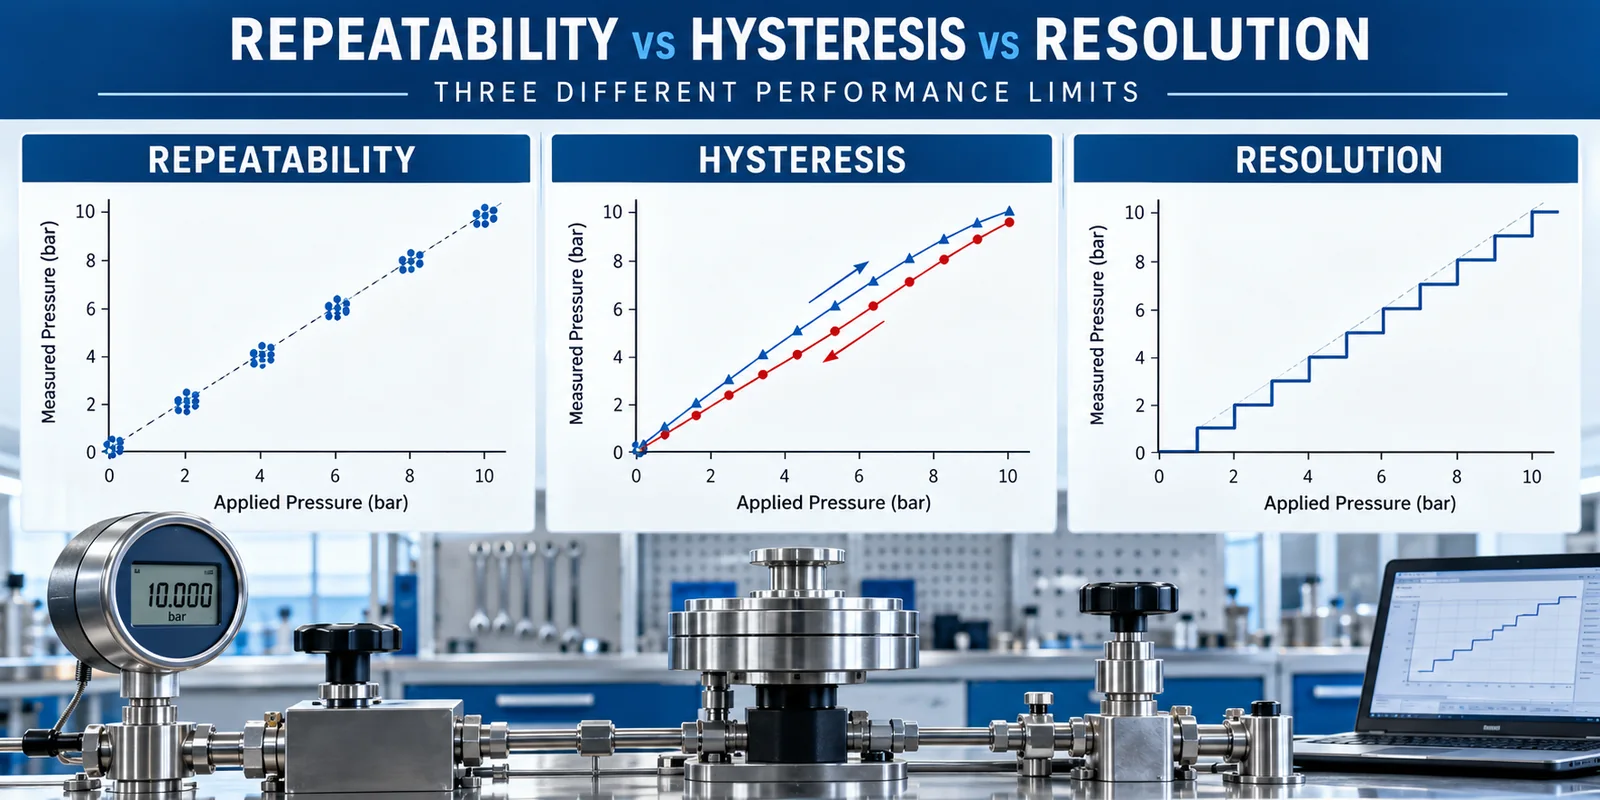
Pressure sensor repeatability, hysteresis and resolution describe three different performance limits. Repeatability is the spread of readings when the same pressure is applied repeatedly under controlled conditions. Hysteresis is the output difference at the same pressure depending on whether pressure is increasing or decreasing. Resolution is the smallest input change the complete measurement chain can distinguish.
None of the three is a substitute for accuracy. A sensor can repeat very tightly but remain offset from the reference. It can have fine digital resolution while its real measurement is noisy or nonlinear. Engineers should test and budget each term separately.
Apa Jawaban Singkatnya?
| Term | Practical question | Typical test |
|---|---|---|
| Pengulangan | If I apply the same pressure again, how close are the readings? | Repeat the same cycle under the same conditions |
| Histeresis | Does the reading depend on the direction of pressure change? | Compare rising and falling readings at identical points |
| Resolution | What is the smallest pressure step the system can distinguish? | Apply controlled small increments and observe stable output changes |
| Ketepatan | How close is the result to a traceable reference? | Compare measured values with a calibrated standard |
The phrase pressure sensor repeatability hysteresis resolution often appears as one specification question, but the correct answer requires four separate ideas: precision, directional behavior, detectable step size and reference error.
Why Is Accuracy Alone Not Enough?
An accuracy statement is meaningful only when its definition and included errors are known. A data sheet may state accuracy as a percentage of full scale, while another may combine nonlinearity, hysteresis and repeatability differently. Temperature error, long-term drift and installation effects may be listed separately.
The existing guide to pressure sensor accuracy in %FS versus %reading explains why the error basis changes the pressure-unit result. For example, ±0.5% FS on a 10 bar sensor corresponds to ±0.05 bar across the stated range, not ±0.5% of every reading.
Repeatability and hysteresis help diagnose how error appears. Resolution tells whether the signal chain can show a small change at all. A complete selection therefore starts with the process tolerance in pressure units and then checks every relevant specification.
What Is Pressure Sensor Repeatability?
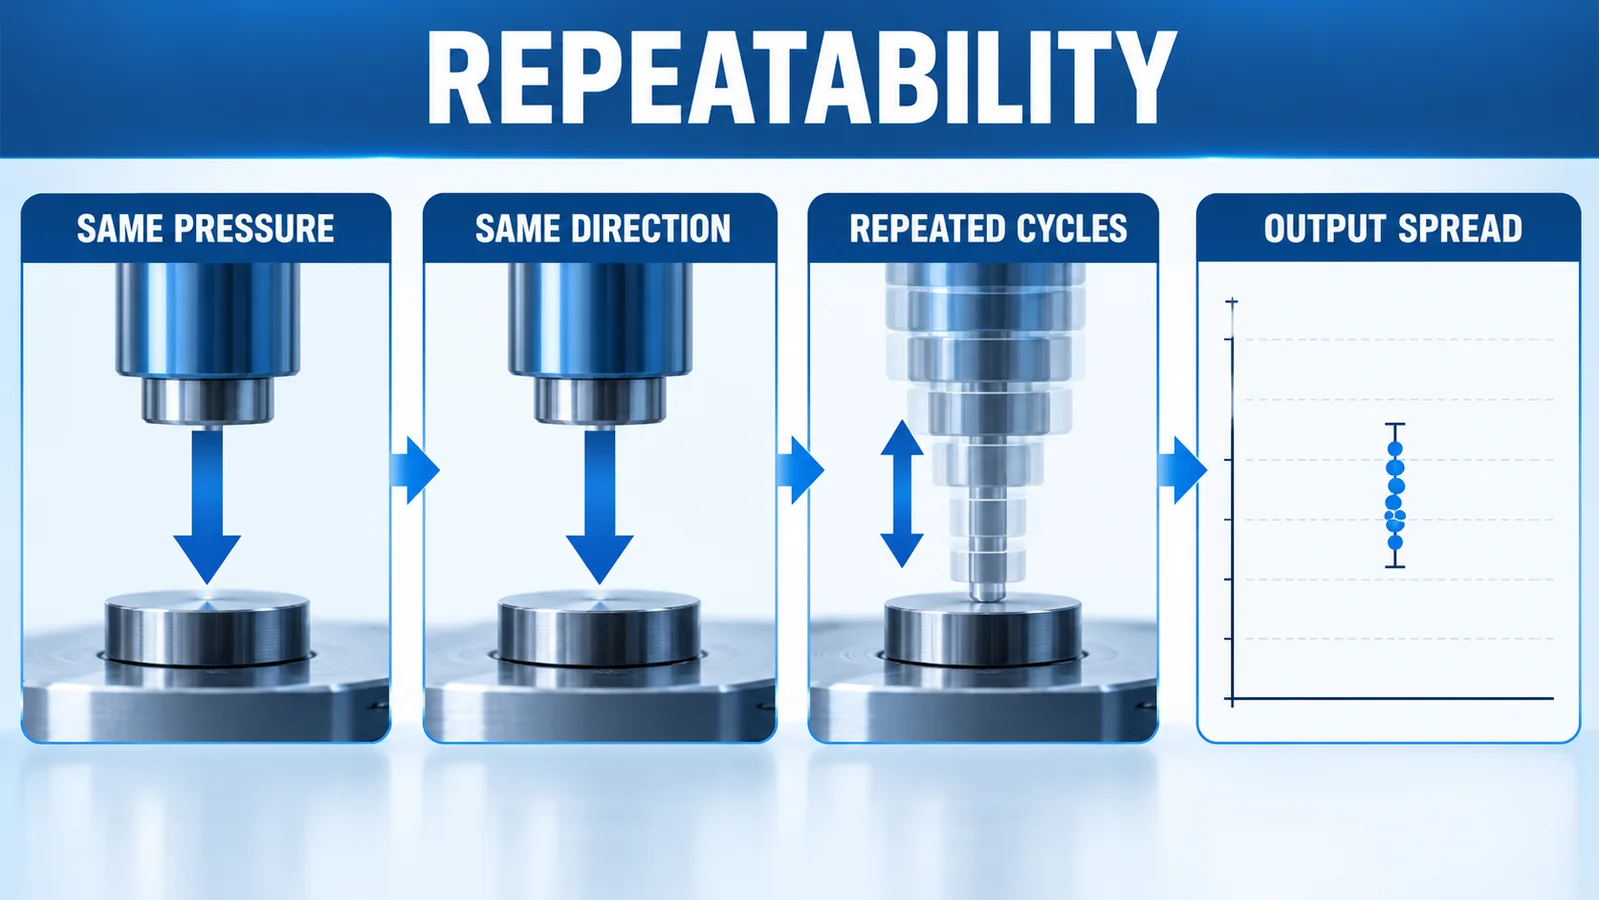
Repeatability is the closeness of outputs obtained when the same input is applied repeatedly under defined repeatability conditions. Those conditions normally keep the method, operator, equipment, location, environment and short time interval as consistent as practical.
For a pressure sensor, a useful repeatability test cycles the device through a defined sequence, approaches each point from the same direction, allows the same stabilization time and records multiple outputs. The result can be expressed as a maximum spread, standard deviation or stated data-sheet convention.
Suppose five rising-pressure readings at 5.000 bar are 5.002, 5.001, 5.003, 5.001 and 5.002 bar. The full spread is 0.002 bar. That small spread shows good repeatability at that test point; it does not prove that 5.002 bar is close to the true pressure without a reference comparison.
Repeatability testing should state:
- pressure point and reference type;
- increasing or decreasing approach;
- stabilization time;
- number of cycles;
- medium and temperature;
- excitation and sampling settings;
- mounting and torque;
- calculation method.
Changing any of these can change the observed spread.
What Is Pressure Sensor Hysteresis?
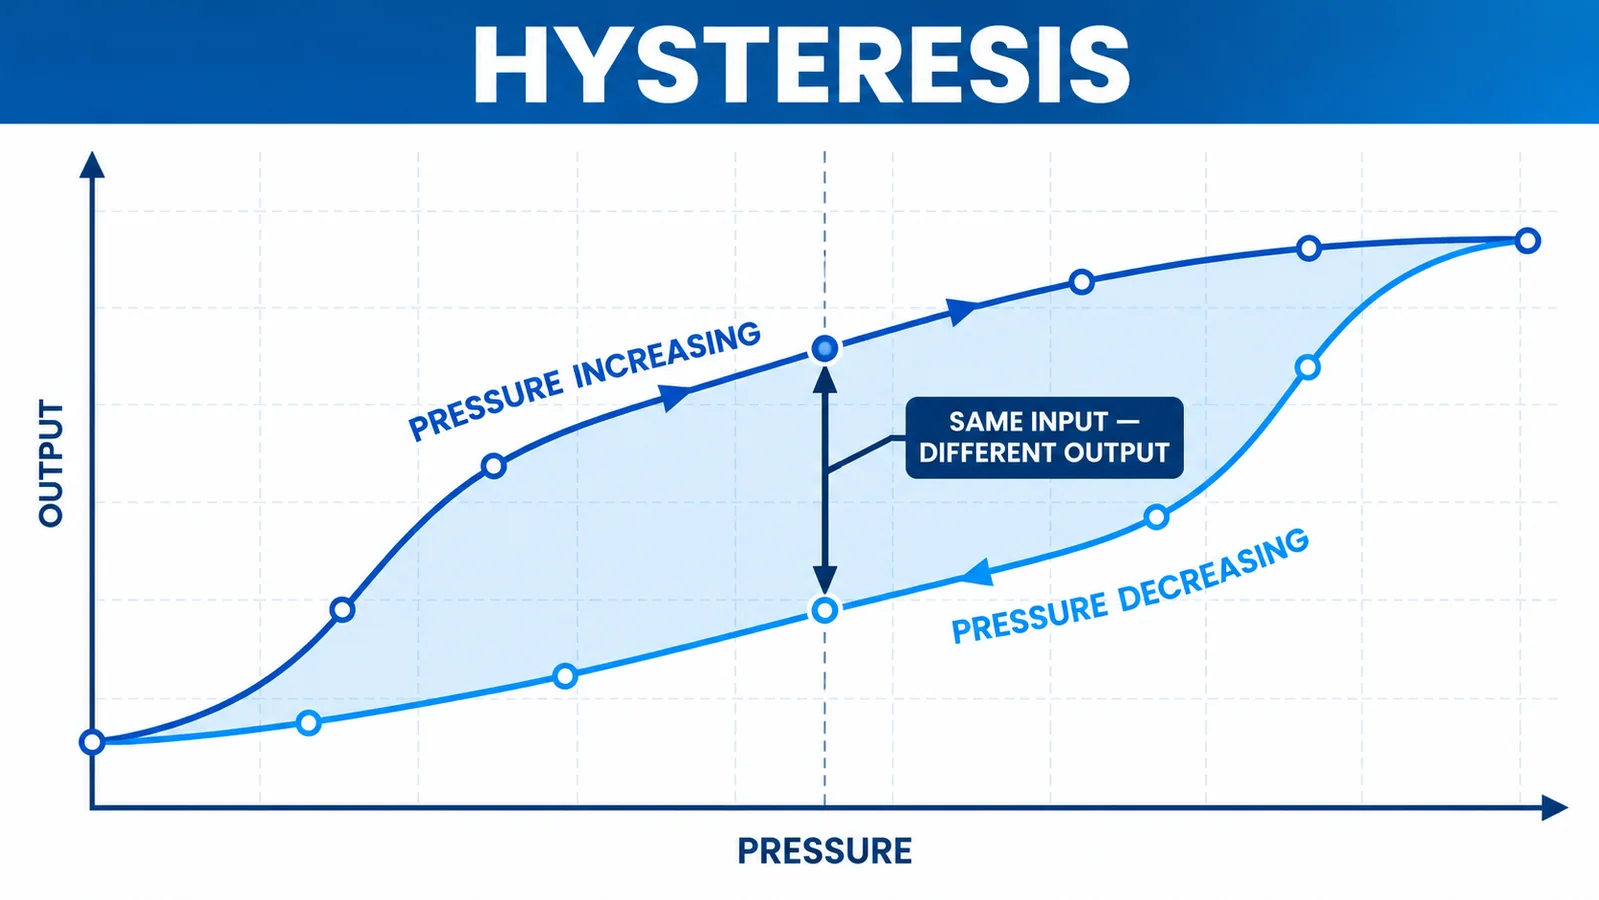
Hysteresis is the difference between outputs at the same input when that input is reached from opposite directions. A typical calibration applies pressure from zero to full scale and then returns from full scale to zero. The rising and falling curves do not perfectly overlap.
If the sensor reads 5.010 bar while pressure rises through 5 bar and 4.995 bar while pressure falls through the same point, the directional difference is 0.015 bar. The relevant specification may report the maximum difference as pressure units, output units or percentage of full scale.
Mechanical diaphragm behavior, bonded materials, seals, packaging stress and previous overload can contribute. Test procedure also matters: insufficient dwell time can mix hysteresis with creep or settling. For liquid systems, trapped gas or a sticky pressure regulator can create apparent hysteresis that belongs to the test setup rather than the sensor.
Always record both the pressure-reference reading and sensor output. Plot the complete up-and-down cycle rather than checking only zero and full scale.
What Is Pressure Sensor Resolution?
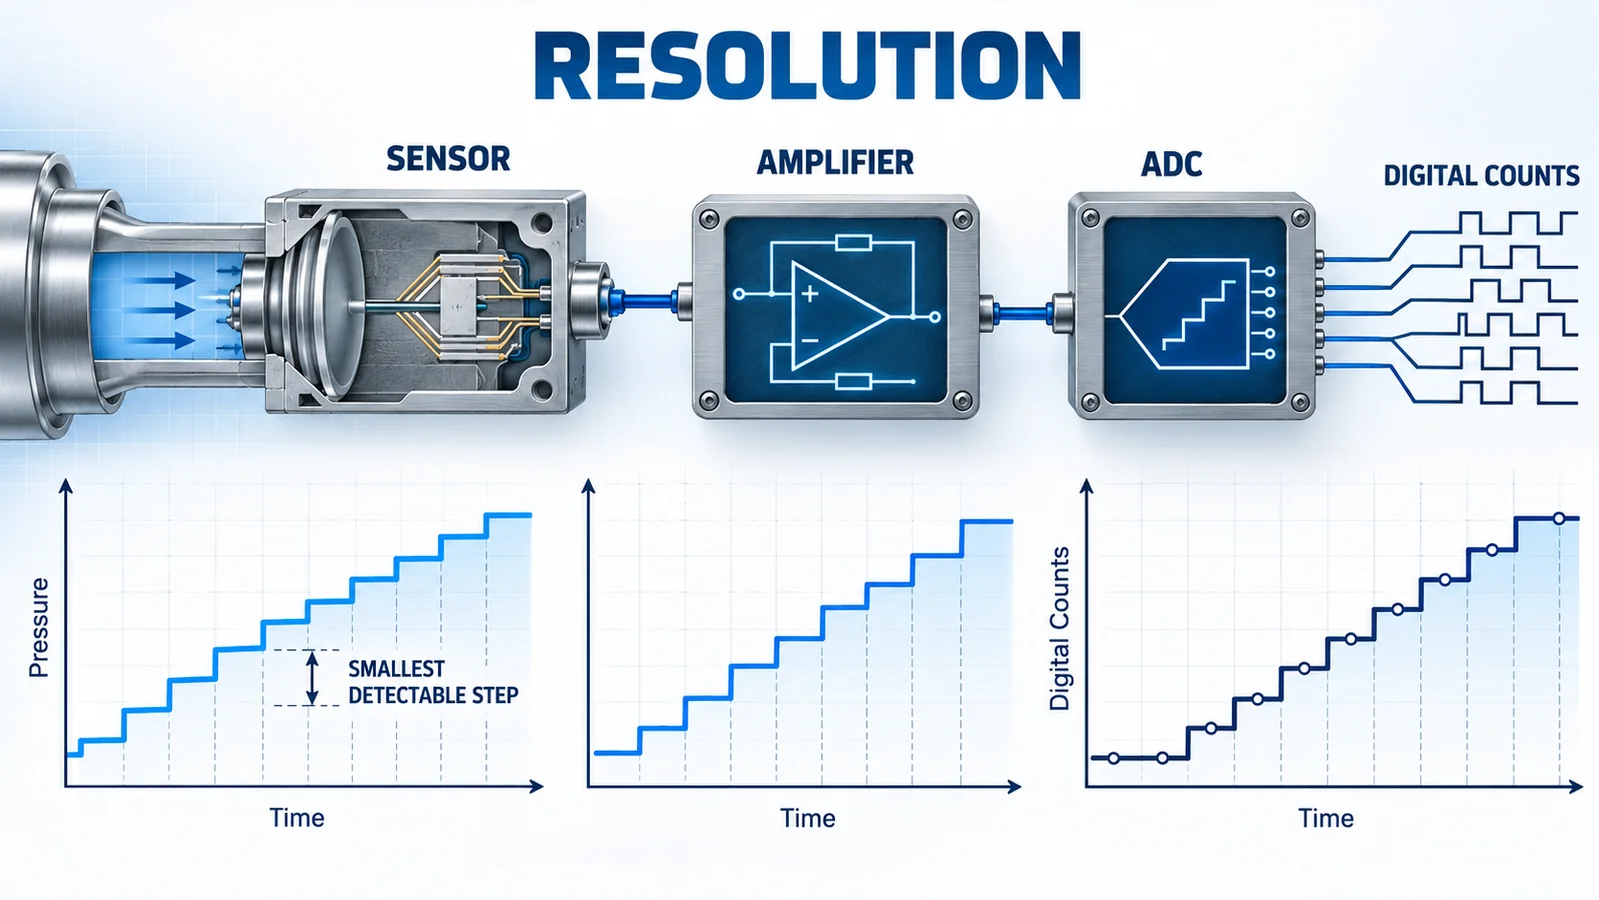
Resolution is the smallest pressure change that produces a distinguishable output change under stated conditions. For a digital device, the ADC bit count sets a theoretical code size, but usable resolution may be worse because of sensor noise, amplifier noise, reference noise, filtering and digital rounding.
A 16-bit ADC across a 0–10 bar range has a theoretical one-count step of approximately 10/65,536 bar, or 0.000153 bar. That arithmetic does not guarantee the system can resolve 0.000153 bar. If the output fluctuates by ten counts peak to peak, the stable detectable change will be larger.
For analog bridge sensors, resolution belongs to the entire chain:
- bridge sensitivity and excitation stability;
- instrumentation-amplifier gain and noise;
- anti-alias filtering;
- ADC input range and effective number of bits;
- sampling and averaging;
- temperature and mechanical noise.
Aggressive averaging can make a display look stable while slowing response. Specify both detectable step and required response time.
How Should the Three Tests Be Run?
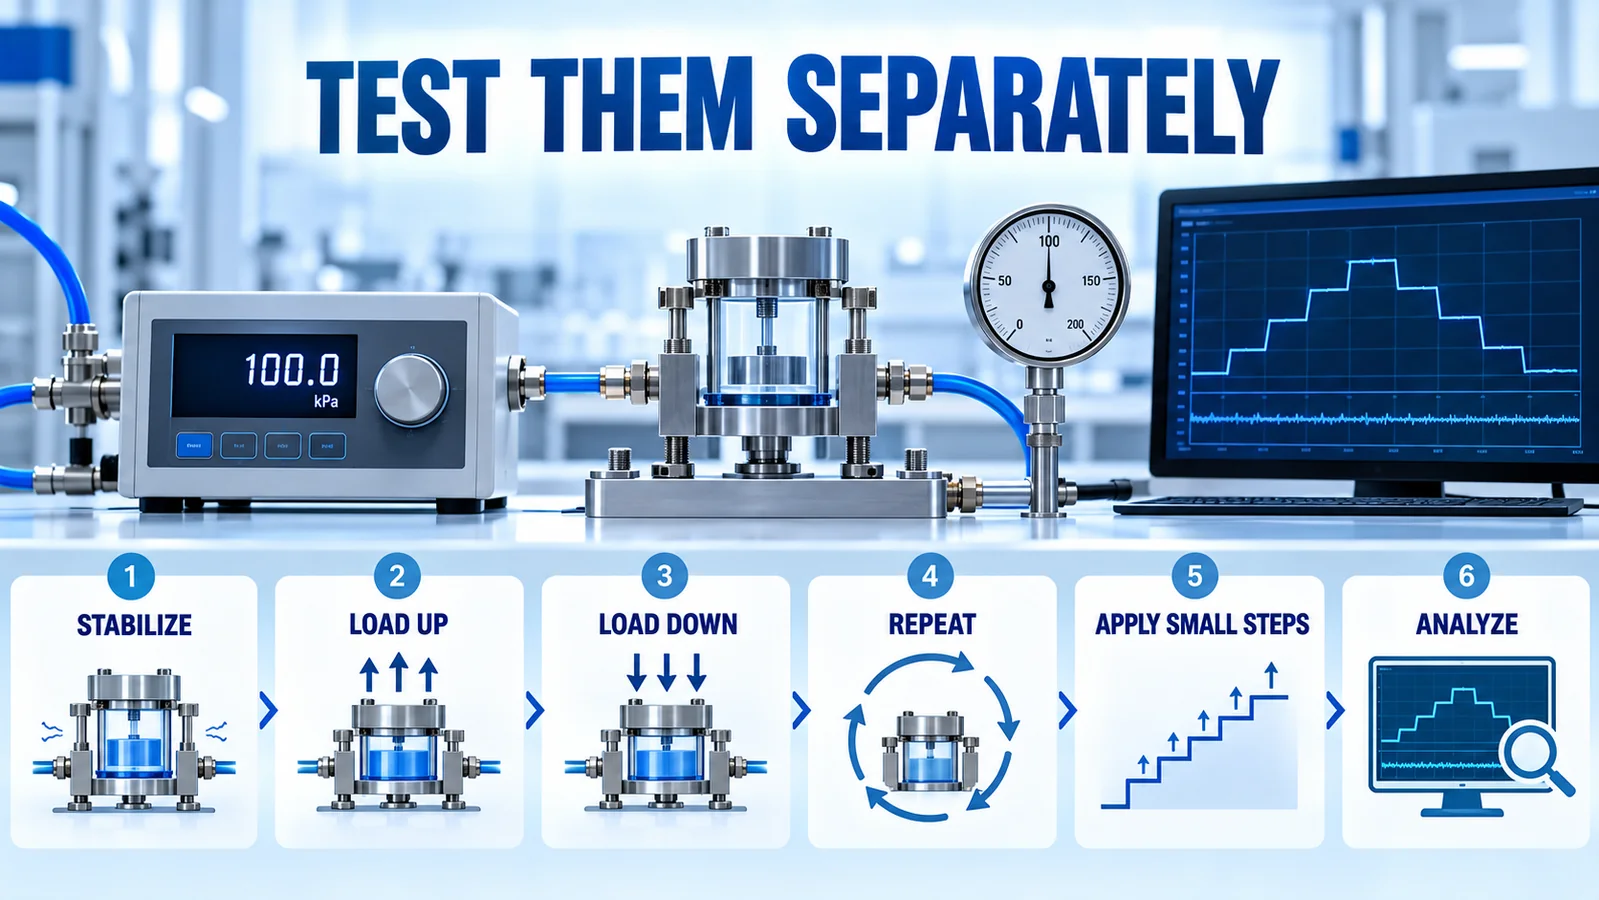
Use a pressure controller and reference whose uncertainty is comfortably smaller than the performance being evaluated. Warm up the sensor and electronics, stabilize the medium and record environmental conditions.
A practical sequence is:
- Exercise the sensor through several preliminary pressure cycles.
- Apply a rising sequence such as 0, 20, 40, 60, 80 and 100% FS.
- Apply the same points in falling order.
- Repeat the complete cycle at least several times.
- Calculate repeatability using same-direction readings at each point.
- Calculate hysteresis using rising-versus-falling readings at identical points.
- At important operating points, apply smaller increments to determine usable resolution.
- Repeat at relevant temperatures when temperature performance matters.
Do not calculate resolution from catalog ADC bits alone, and do not calculate repeatability by mixing rising and falling data.
Worked Example: Same Sensor, Different Conclusions
Consider a 0–10 bar system tested at 5 bar:
- rising readings over three cycles: 5.012, 5.010 and 5.011 bar;
- falling readings: 4.996, 4.997 and 4.995 bar;
- reference pressure: 5.000 bar;
- smallest stable change observed: 0.003 bar.
The rising repeatability spread is 0.002 bar. The falling spread is also 0.002 bar. The mean rising value is about 5.011 bar, while the mean falling value is 4.996 bar, producing approximately 0.015 bar hysteresis at that point. The usable resolution from the test is 0.003 bar.
This sensor repeats well but has a larger directional difference than its repeatability spread. A one-direction calibration could hide that behavior. A high-resolution display would not remove it.
Build a System Error Budget
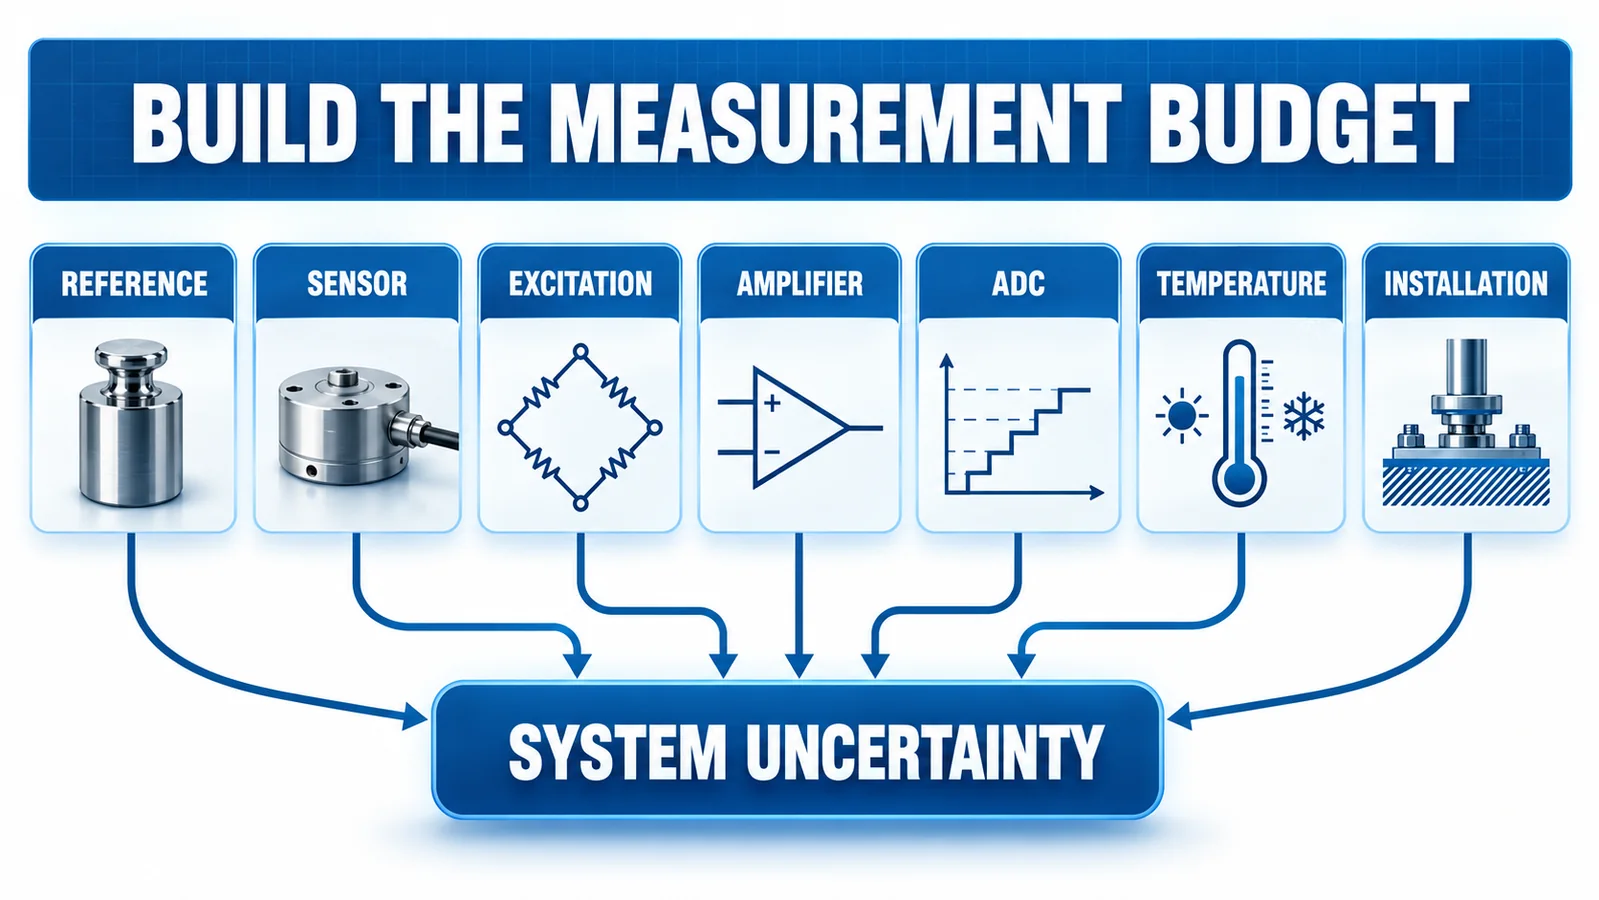
Selection should begin with the allowable system error at critical pressure points. Budget contributions from:
- reference uncertainty during calibration;
- nonlinearity, hysteresis and repeatability;
- zero and span temperature error;
- bridge excitation or loop supply;
- amplifier gain, offset and drift;
- ADC reference, noise and quantization;
- process tap, mounting position and trapped gas;
- long-term stability and calibration interval.
Not every term should simply be added arithmetically; the combination method depends on whether limits, distributions and correlations are known. The important first step is to avoid counting the same included term twice or omitting a separately stated term.
How Should These Terms Be Written in an RFQ?
Avoid a single request such as “accuracy better than 0.1%.” State the operating points and the behavior that matters. A stronger RFQ says, for example: the system must detect a 0.01 bar change within 200 ms, repeated readings at 5 bar must remain within a stated band, and rising-versus-falling difference must not move the control threshold outside its allowed tolerance.
Ask the supplier to identify:
- the calculation method and denominator;
- whether the value is typical or maximum;
- test temperature and compensation interval;
- stabilization time and pressure-cycle sequence;
- included and excluded errors;
- output bandwidth or filter setting;
- conditions after mounting and calibration.
This makes quotations comparable and tells the OEM what still has to be validated in the finished product.
Itu panduan pemilihan sensor tekanan industri provides the wider checklist for range, overload, media, temperature, output and installation.
How Do WPAH31 and WPAK63 Fit?
Itu Winsen WPAH31 is a ceramic piezoresistive cell with a millivolt bridge output. It is an OEM sensing component. The equipment maker must design excitation, amplification, ADC conversion, compensation, packaging and final calibration. System resolution and installed repeatability therefore cannot be inferred from the cell name alone.
Itu Winsen WPAK63 is an isolated diffused-silicon pressure core. Its raw output likewise requires suitable signal conditioning and final-system verification. Isolation-film packaging changes the mechanical structure, but selection still depends on the exact ordered range, reference type and data sheet.
Saat ini petunjuk WPAK63 should be used for range-specific electrical and mechanical information. Product-page summaries are not a substitute for the ordered configuration and production calibration record.
These products illustrate two sensing architectures. Do not copy a repeatability, hysteresis or resolution value from one family or range to another. Request the current data sheet for the exact configuration and verify the complete assembly.
For help separating raw cores from conditioned products, see pressure sensor core versus transmitter.
Verification Checklist Before Release
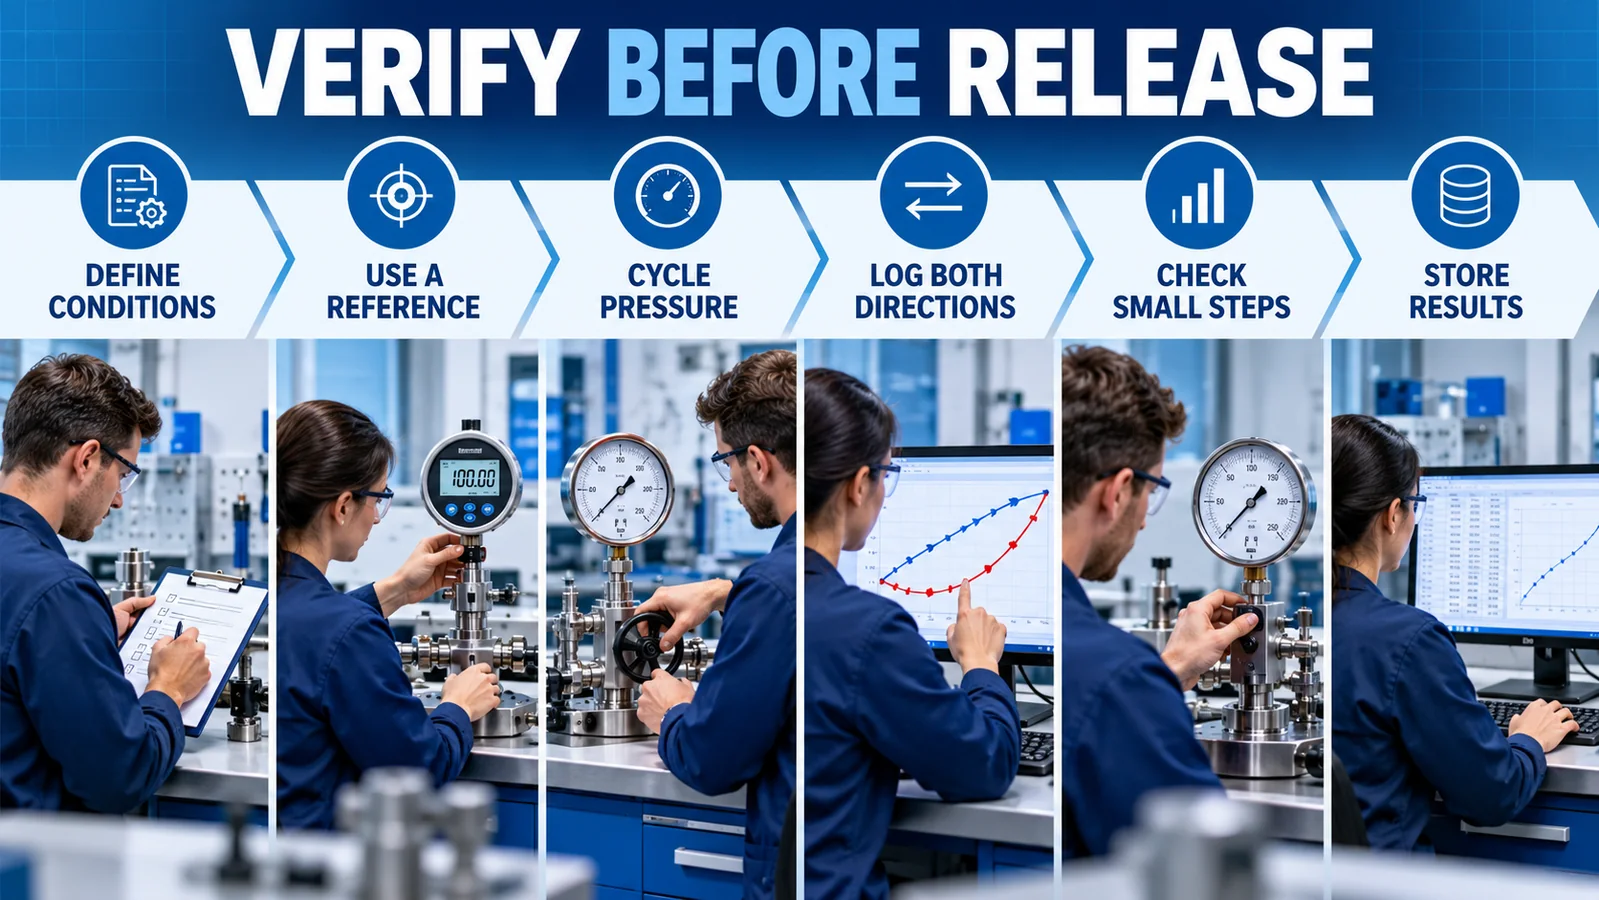
- Define the required tolerance in pressure units.
- State whether errors are %FS, %span or %reading.
- Identify which errors the published accuracy includes.
- Use a traceable reference with adequate uncertainty ratio.
- Record rising and falling data over multiple cycles.
- Test usable resolution with the production electronics and filter settings.
- Repeat at relevant temperatures and supply conditions.
- Recheck after final mounting, sealing and torque.
- Store raw data, calculations, serial number and configuration revision.
Pertanyaan Umum
Is repeatability the same as accuracy?
No. Repeatability describes agreement among repeated results. Accuracy describes closeness to a reference under the stated definition.
Is hysteresis part of accuracy?
Sometimes a published accuracy figure includes hysteresis; sometimes it is stated separately. Read the exact data-sheet definition.
Does a 24-bit ADC give 24-bit pressure resolution?
No. Noise, effective number of bits, bridge sensitivity, excitation, amplifier performance and filtering determine usable resolution.
Can software calibration remove hysteresis?
A calibration model may reduce predictable directional error if operating direction is known, but it cannot make unstable mechanical behavior disappear. Verify the result over cycles and temperature.
Kesimpulan
Pressure sensor repeatability, hysteresis and resolution answer different questions. Repeatability needs repeated same-direction measurements, hysteresis needs rising and falling curves, and resolution needs controlled small steps through the production signal chain. Define the process tolerance first, verify each term independently and select the architecture and electronics as one system. For an application review, hubungi Winsen with the range, temperature, output and required uncertainty.
