
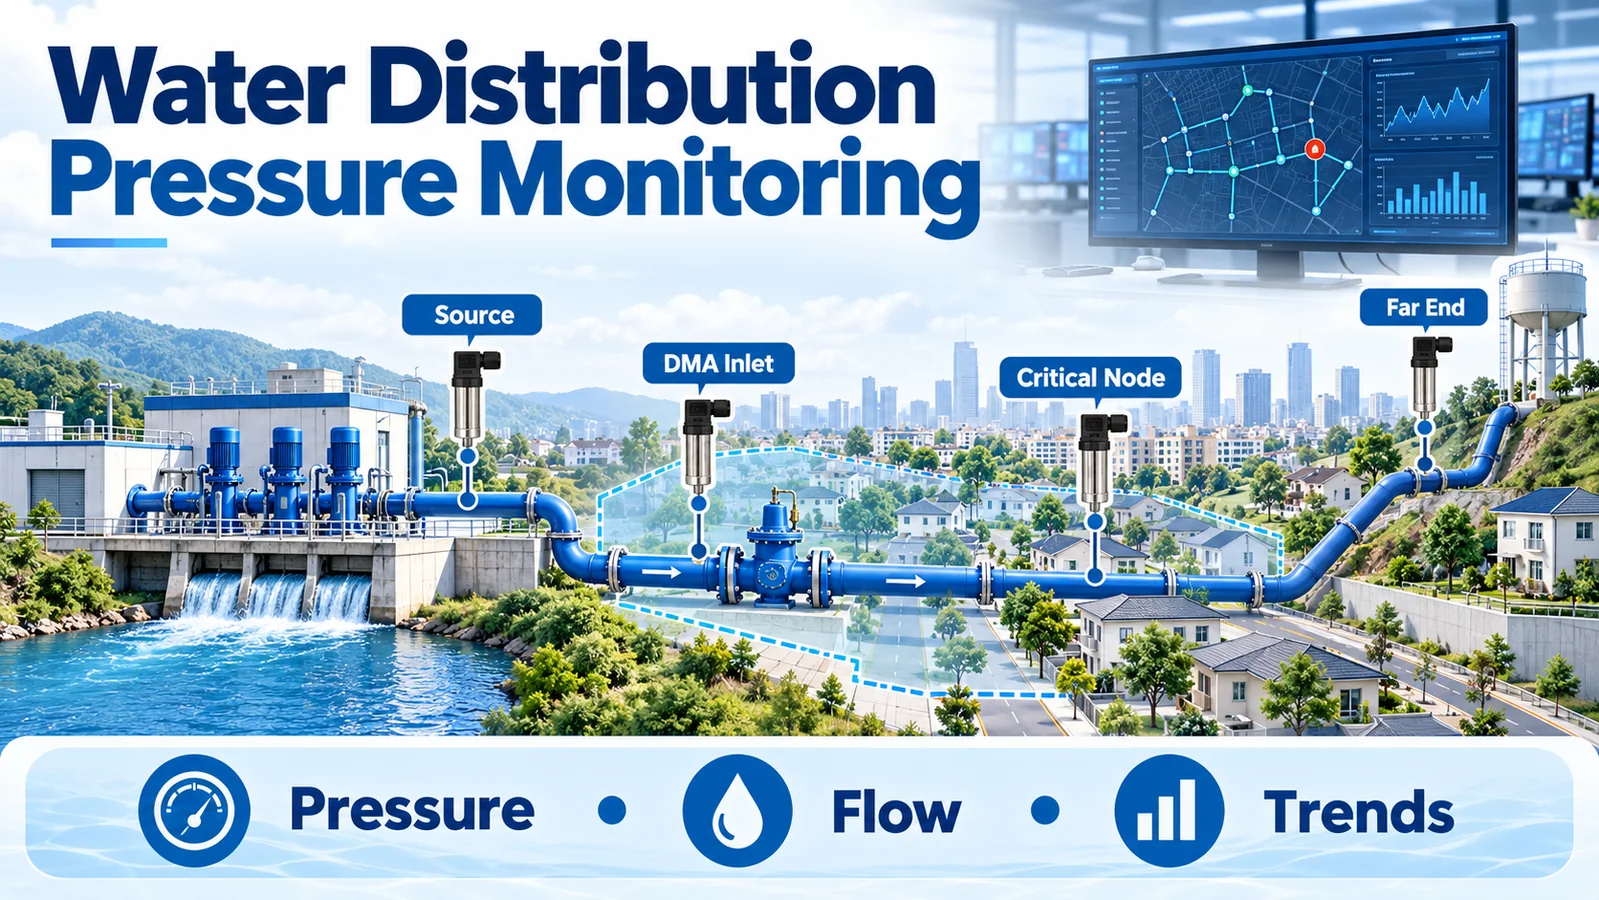
UN water distribution pressure sensor should be placed where its data answers a defined hydraulic question: Is the source stable? Is a pressure-reducing valve holding its setpoint? Is a district metered area receiving adequate pressure? Is a high-elevation or remote customer at risk of low service pressure? Is an abnormal pressure change local or network-wide?
For a practical first deployment, monitor the supply or pump discharge, both sides of important pressure-control assets, DMA inlets, critical low-pressure nodes, remote ends and known weak sections. Then interpret pressure as a time series alongside flow, pump status, valve position and tank level. A pressure drop can support a leak investigation, but it does not prove that a leak exists.
| Monitoring objective | Useful pressure point | Data that adds context |
|---|---|---|
| Verify supply stability | Source header or pump discharge | Pump speed/status, tank level, outlet flow |
| Check pressure control | Upstream and downstream of a PRV | Valve position, setpoint, downstream demand |
| Track a district | DMA inlet plus one or more critical nodes | Inlet flow, boundary-valve status, time of day |
| Protect service pressure | High-elevation or hydraulically remote node | Demand pattern, modeled minimum-pressure scenario |
| Investigate losses | Leak-sensitive nodes selected from hydraulic scenarios | Flow balance, neighboring pressures, work orders |
| Watch vulnerable assets | Near recurrent failures or surge exposure | Transient logging, valve and pump events |
What Does a Water Distribution Pressure Sensor Tell You?
A pressure transmitter converts pressure at one tapping point into an electrical or digital signal for a controller, logger or SCADA system. In most distribution applications, operators want pression de mesure, the pressure relative to local atmosphere. The reading describes one node at one time; it is not a direct measurement of flow, leakage or pressure everywhere else in the network.
Pressure is related to hydraulic grade and node elevation. For water at ordinary distribution temperatures, the static relationship is approximately:
Gauge pressure ≈ ρg × pressure head
où ρ is water density, g is gravitational acceleration and pressure head is the vertical distance between the hydraulic grade line and the measurement elevation. A lower-elevation node can therefore show a higher pressure than a high-elevation node even when both belong to the same pressure zone.
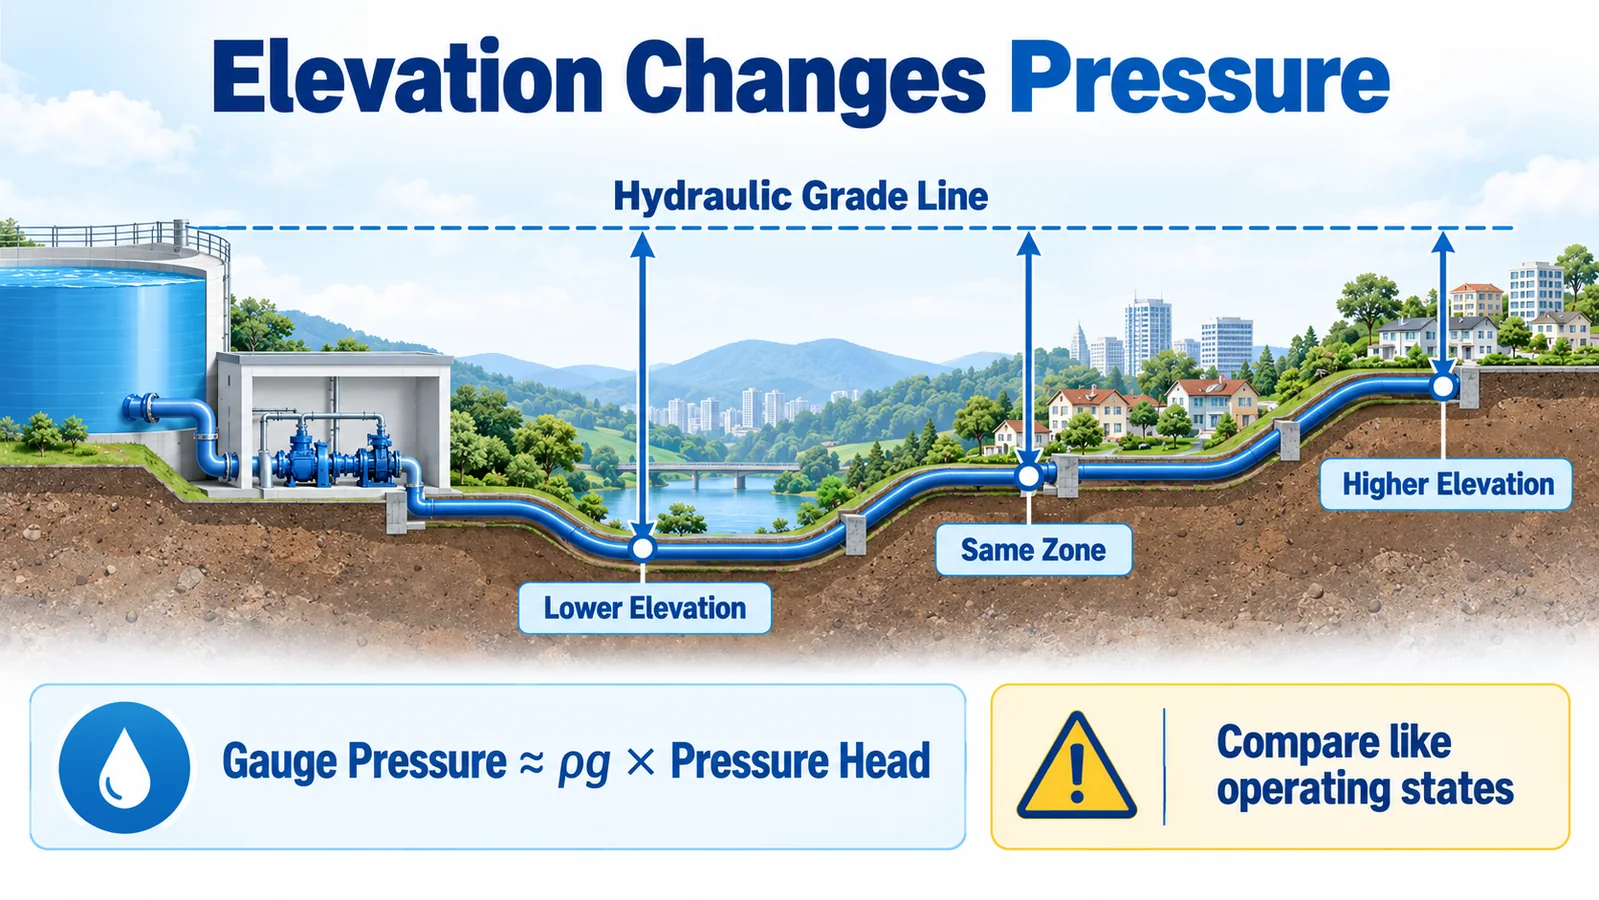
This is why useful comparisons preserve context. Compare the same node at similar demand and operating states, or compare several nodes after accounting for elevation, zone boundaries, pump operation and valve settings. The US EPA EPANET hydraulic model represents node pressures, pipe flows, pumps, valves, tanks and time-varying demands, making it a practical platform for testing monitoring scenarios.
Where Should Pressure Sensors Be Placed?
There is no universal spacing rule. A sensor every fixed distance may leave a critical high point unobserved while duplicating information in a hydraulically uniform area. Begin with the operating decisions the data must support.

1. Sources, reservoirs and pump discharge headers
Measure pressure where water enters the distribution system and after major booster stages. These points establish the upstream boundary condition. A network-wide pressure reduction is easier to interpret when the source measurement shows whether a pump stopped, a tank level changed or supply pressure fell.
2. Upstream and downstream of pressure-control assets
Pressure-reducing valves, control valves and booster stations deliberately change the hydraulic grade. Measuring on both sides helps separate an upstream shortage from a downstream control problem. One downstream sensor alone cannot reveal whether the change originated before or at the valve.
3. DMA inlets and zone boundaries
A district metered area normally uses a defined inlet flow measurement and controlled boundary valves. Pressure at the inlet shows the hydraulic condition entering the district; selected internal nodes reveal whether that condition reaches customers. A DMA inlet is also a convenient location for telemetry, but it should not be the only pressure point if the zone has large elevation changes or long, restrictive mains.
4. Critical low-pressure nodes
High elevations, long paths from the source, small-diameter branches and large-demand customers can become pressure-limiting points. Select these nodes using the hydraulic model and field verification. Local service requirements and emergency-flow criteria must come from the utility’s applicable rules; a universal minimum value should not be copied from an unrelated system.
5. Remote ends and known weak assets
Remote or dead-end sections can expose pressure loss that an inlet sensor does not show. Recurrent-break areas, old mains, surge-prone branches and important crossings may justify additional monitoring. The value comes from the decision the point supports, not simply from labeling the location “critical.”
How Do You Choose Locations Systematically?
Use a repeatable process rather than an attractive map alone:
- Define the objective. Service-pressure assurance, PRV verification, model calibration, burst detection and leak localization require different evidence.
- Build credible operating scenarios. Include normal daily demand, low-demand periods, pump and tank states, valve configurations, high demand, outages and plausible leaks.
- Screen candidate nodes. Exclude inaccessible or unsafe sites and identify points where installation, power, telemetry and maintenance are practical.
- Measure information value. Prefer nodes whose simulated responses distinguish scenarios and improve coverage. Peer-reviewed placement work uses pressure sensitivity, information value, clustering and uncertainty rather than simple equal spacing.
- Check redundancy and failure tolerance. Two nearby sensors that always move together may contribute less than one at a different hydraulic region. Some redundancy is still useful for validation and fault detection.
- Deploy in phases. Install a defensible first set, compare field data with the model, recalibrate assumptions and add or relocate instruments where uncertainty remains.
Research on pressure-sensor deployment under practical constraints explicitly considers budgets, available locations and sensor faults. Another study on measurement uncertainty and leak-sensitive placement shows why demand scenarios and measurement error belong in the design. These methods do not produce one universal layout; they provide a disciplined way to design a layout for a specific network.
Which Pressure Patterns May Indicate a Leak?
The most useful leak indicator is a deviation from an expected pattern after known operating changes are considered. Four patterns deserve investigation:

| Pattern | Possible leak-related meaning | Other causes to check |
|---|---|---|
| Sudden, persistent step down | A new burst or rapidly growing leak may have increased outflow | Pump trip, valve movement, fire flow, main isolation, sensor offset |
| Gradual downward drift | A leak may be growing or network resistance may be increasing | Seasonal demand, tank operating level, PRV drift, fouling, calibration drift |
| Unusual overnight pressure/flow relationship | Continuous loss may remain when legitimate demand is low | Night operations, filling storage, industrial demand, meter timing errors |
| Similar drop at neighboring nodes with stable upstream reference | A disturbance may lie in the shared downstream area | Local valve change, planned flushing, pressure-control behavior |
An isolated spike or drop can also be a transient rather than a sustained hydraulic change. Sampling interval, filtering and communications may hide or reshape short events. If transient capture matters, specify the acquisition rate and dynamic response for that task; a slow telemetry report interval cannot preserve a millisecond event simply because the sensing element is fast.
Why Combine Pressure with Flow and Operating-State Data?
Pressure is most actionable when every signal uses a synchronized clock and the analysis knows the network state.
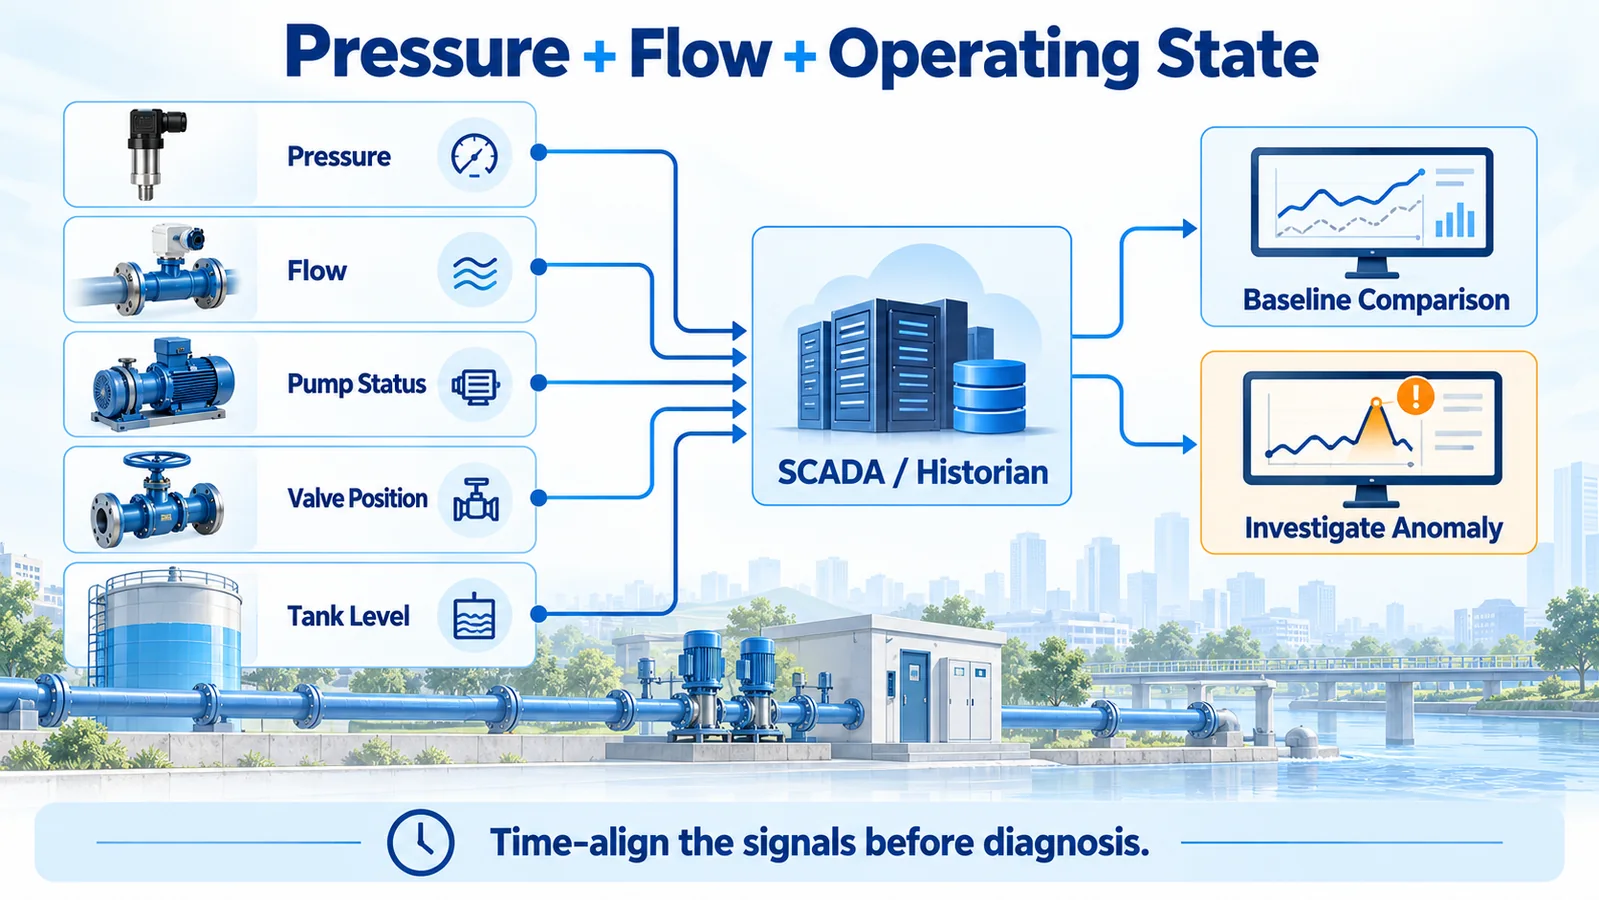
- Flow shows whether water entering a DMA changed when pressure deviated. A pressure decrease with higher unexplained inlet flow is different from a pressure decrease during a pump shutdown.
- Pump status and speed identify source changes that can affect many sensors together.
- Valve position and commands reveal intentional topology or control changes.
- Tank or reservoir level changes the available hydraulic head.
- Neighboring pressure nodes show whether an event is local, zonal or system-wide.
- Maintenance records explain flushing, hydrant use, isolation and construction work.
Store raw values, timestamps, quality flags and configuration changes before calculating alarms. Build baselines by node, day type, time and operating mode. Fixed thresholds are useful for service limits, while model or history-based residuals can reveal smaller deviations. Both require validation when the sensor, pipework or control logic changes.
How Do You Select a Pressure Transmitter for the Network?
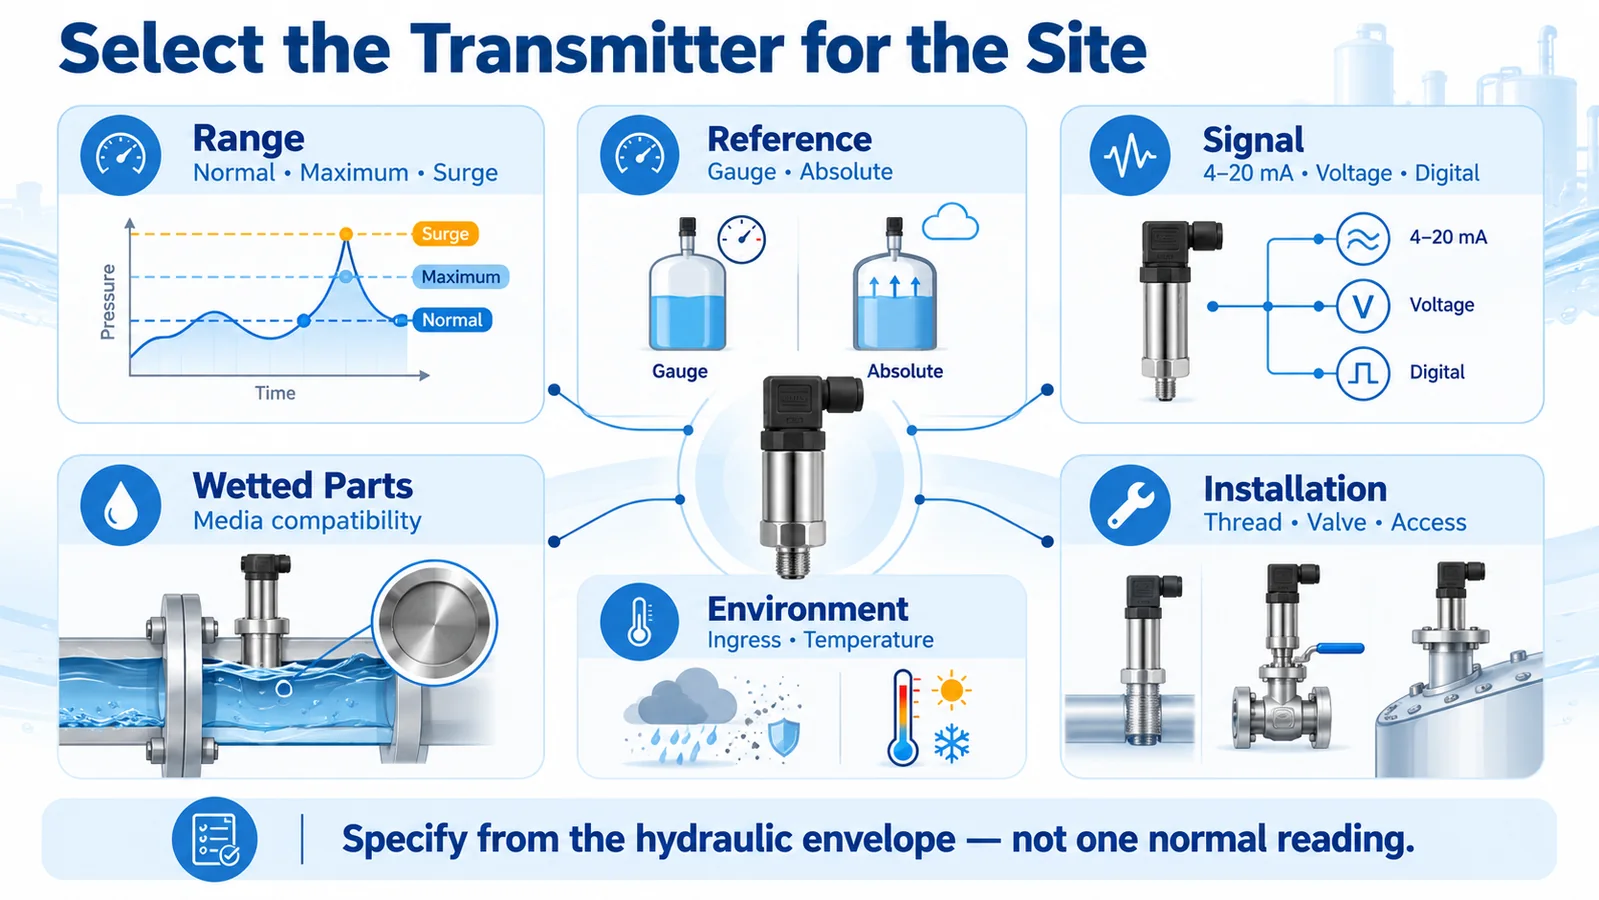
The correct transmitter is defined by the hydraulic envelope and site conditions, not by one normal reading.
Range, reference and performance
Record normal, minimum, maximum and credible transient pressure. Choose a range that covers expected operation with appropriate margin while preserving useful resolution. Confirm overload and burst limits separately from measurement range. Gauge reference is common for service pressure; absolute or sealed-gauge configurations may be appropriate in specific designs, but the control system and engineering calculation must use the same reference.
Accuracy should be read as a complete specification. A ±0.5% FS statement means the error is related to the selected full-scale range, so oversizing that range increases the absolute error allowance. The detailed guide to pressure sensor accuracy in %FS and %reading shows the calculation.
Output, power and telemetry
For long cable runs and industrial controllers, 4–20 mA is common because the current signal is robust and provides a live-zero convention. Voltage and digital interfaces can suit local electronics and lower-power terminals when cable length, grounding, surge protection and protocol support are designed together. Do not choose an output before checking the logger input, supply voltage, wiring topology and fault-detection requirements.
Wetted materials, enclosure and connection
Confirm compatibility of the diaphragm, pressure port and seals with the actual water chemistry and cleaning conditions. A 316L diaphragm statement alone does not establish drinking-water approval. Specify any required potable-water certification for the complete configured assembly.
Outdoor pits and chambers can expose equipment to immersion, condensation, dust, temperature cycling, lightning-induced surge and mechanical damage. Match the complete installation—including cable entry, connector and enclosure—to the environment. Provide an isolation valve, a suitable pressure tapping, service access and protection from trapped debris or air. Verify the mechanical connection using the NPT versus G thread guide rather than assuming thread names are interchangeable.
Where Can Winsen WPCK07 and WPCK63 Fit?
Two Winsen transmitter families can be evaluated for water-network equipment, with the final configuration confirmed against the current data sheet and project requirements.
| Modèle | Verified published characteristics | Potential fit and boundary |
|---|---|---|
| WPCK07 | Diffused silicon; gauge, absolute and sealed-gauge references; 4–20 mA default plus listed voltage outputs; ±0.5% FS; 316L diaphragm; IP65; pipeline pressure monitoring listed | Panel, plant or protected pipeline locations where the selected range, output, connection and environmental protection meet the design |
| WPCK63 | Compact diffused-silicon transmitter; gauge, absolute and sealed-gauge options; published 0.2–2.3 V or I²C options; ±0.5% FS; 316L diaphragm; IP68; smart water supply and water treatment listed | Remote or moisture-prone monitoring terminals where the exact IP68 configuration, power, output, connector and installation are confirmed |
The broad model range does not replace application review. Share the required pressure range, transient envelope, reference type, medium, temperature, output, supply, cable length, connection, enclosure exposure and approvals with the manufacturer. For a broader decision process, use the industrial pressure sensor selection checklist.
How Should the Installation Be Commissioned?
Before relying on trends or alarms:
- Verify the model, configured range, pressure reference, output and wiring against the order and controller configuration.
- Inspect the tapping point, isolation valve, seals, orientation and cable entry. Confirm there is no trapped air, blockage or leak in the measurement connection.
- Compare the installed transmitter with a suitable reference at the same pressure point. Record the reference instrument and uncertainty.
- Observe more than one hydraulic state: normal demand, a controlled pump or valve change where permitted, and a low-demand period.
- Confirm engineering units, scaling, timestamps, signal quality and alarm delays from the field device through the historian.
- Establish the baseline only after the node and operating states are understood. Record maintenance and calibration intervals based on risk and performance history.
How Do You Validate a Pressure Anomaly?
Use a consistent response workflow before classifying the event.
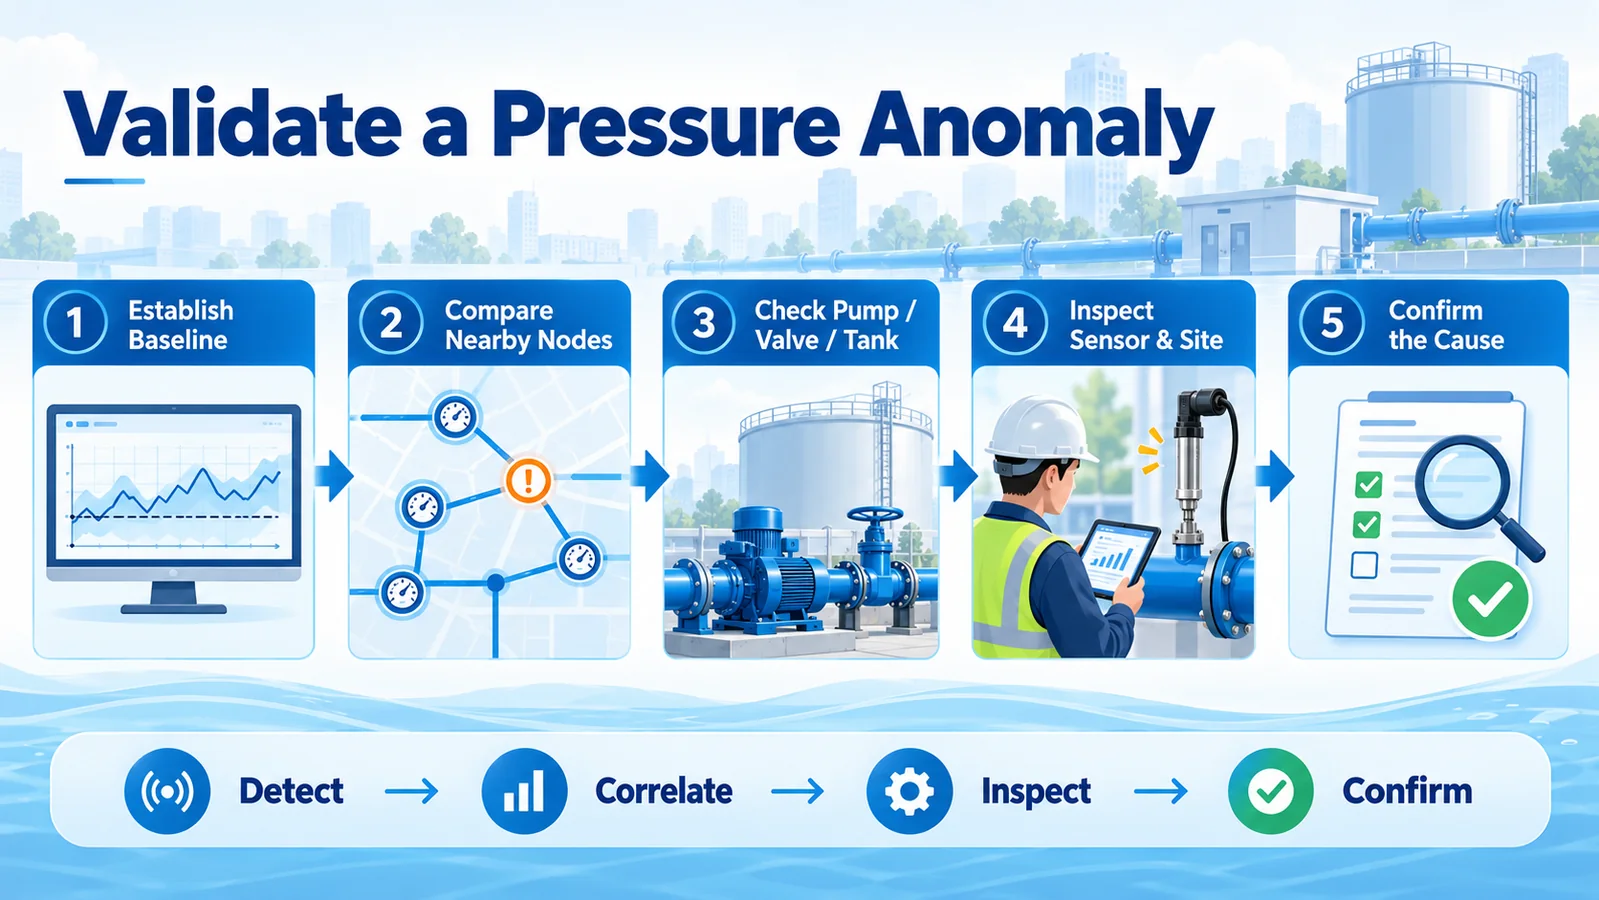
- Establish the deviation. Compare with the node’s relevant baseline, not an unrelated average.
- Compare nearby and upstream nodes. Determine the spatial extent and whether the source changed.
- Check pump, valve and tank records. Rule in or out a known operating event.
- Inspect the signal and site. Look for power, communications, wiring, tapping, isolation-valve or calibration problems.
- Confirm the cause. Use field inspection, flow evidence, acoustic methods, step testing or another utility-approved method before declaring or locating a leak.
This process protects operators from two costly errors: ignoring a real hydraulic event because one point looks noisy, and dispatching a leak crew for an instrumentation or operations issue.
RFQ Checklist for an OEM Monitoring Terminal
Provide these inputs when requesting a pressure transmitter or integrated node:
- normal, minimum and maximum pressure, plus known surge conditions;
- référence à jauge, absolue ou à jauge scellée ;
- water chemistry, wetted-material and potable-water approval requirements;
- ambient and medium temperature;
- indoor, outdoor, pit, chamber or immersion exposure;
- output, supply voltage, cable length, connector and telemetry interface;
- required accuracy, resolution, sampling and report interval;
- process connection, isolation valve and available installation envelope;
- EMC, surge/lightning protection and grounding requirements;
- calibration, maintenance access, expected life and project quantity.
Need a pressure transmitter for a water-network monitoring terminal? Share the hydraulic envelope, installation environment and telemetry interface through the Winsen contact page. Winsen can help evaluate a configuration, while the utility or system designer retains responsibility for placement, alarm logic and regulatory compliance.
Foire aux questions
How many pressure sensors does a water distribution network need?
There is no fixed number per kilometer or per customer. The count depends on network topology, pressure zones, objectives, candidate installation sites, uncertainty and budget. Use hydraulic scenarios to measure coverage and sensitivity, then validate the first deployment with field data.
Is a sudden pressure drop proof of a water leak?
No. It is an investigation trigger. Pump trips, valve operations, tank-level changes, firefighting, flushing, demand changes, transients, communications faults and sensor problems can create similar readings. Confirm the event with other nodes, operating records, flow and field evidence.
Should pressure sensors be installed at DMA inlets or at network ends?
Both can be useful for different purposes. The inlet defines the zone’s entering pressure and pairs naturally with inlet flow. A remote, high or otherwise critical internal node shows whether adequate pressure reaches a vulnerable part of the DMA.
Why measure pressure upstream and downstream of a PRV?
The two readings separate supply variation from valve performance and downstream demand. A low downstream reading alone cannot show whether upstream pressure fell or the PRV/control system caused the change.
Should a water network use gauge or absolute pressure?
Gauge pressure is common for distribution service because it represents pressure relative to atmosphere. Use absolute or sealed-gauge pressure only when the system calculation, electronics and specification call for that reference. Keep the reference type consistent throughout data scaling and analysis.
How often should a network pressure transmitter be calibrated?
Use an interval based on consequence, site conditions, stability history, manufacturer guidance and the utility’s quality system. Commission every installation against a suitable reference, trend drift and shorten the interval when evidence or risk requires it.
