
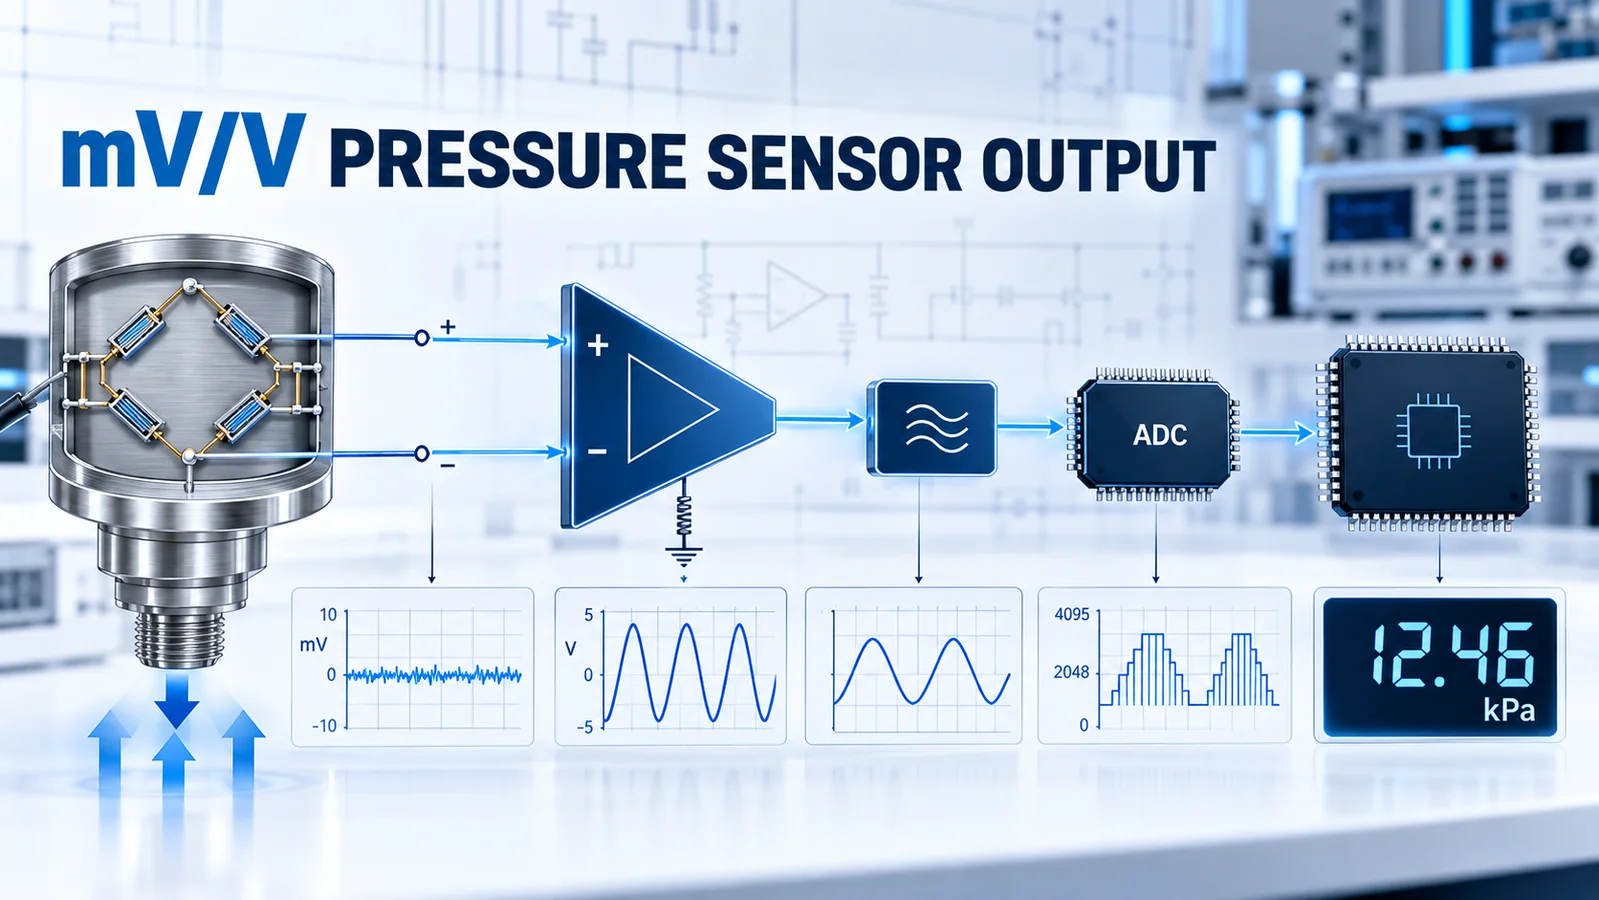
A pressure sensor rated in millivolts per volt produces a small differential voltage proportional to its excitation. The basic calculation is:
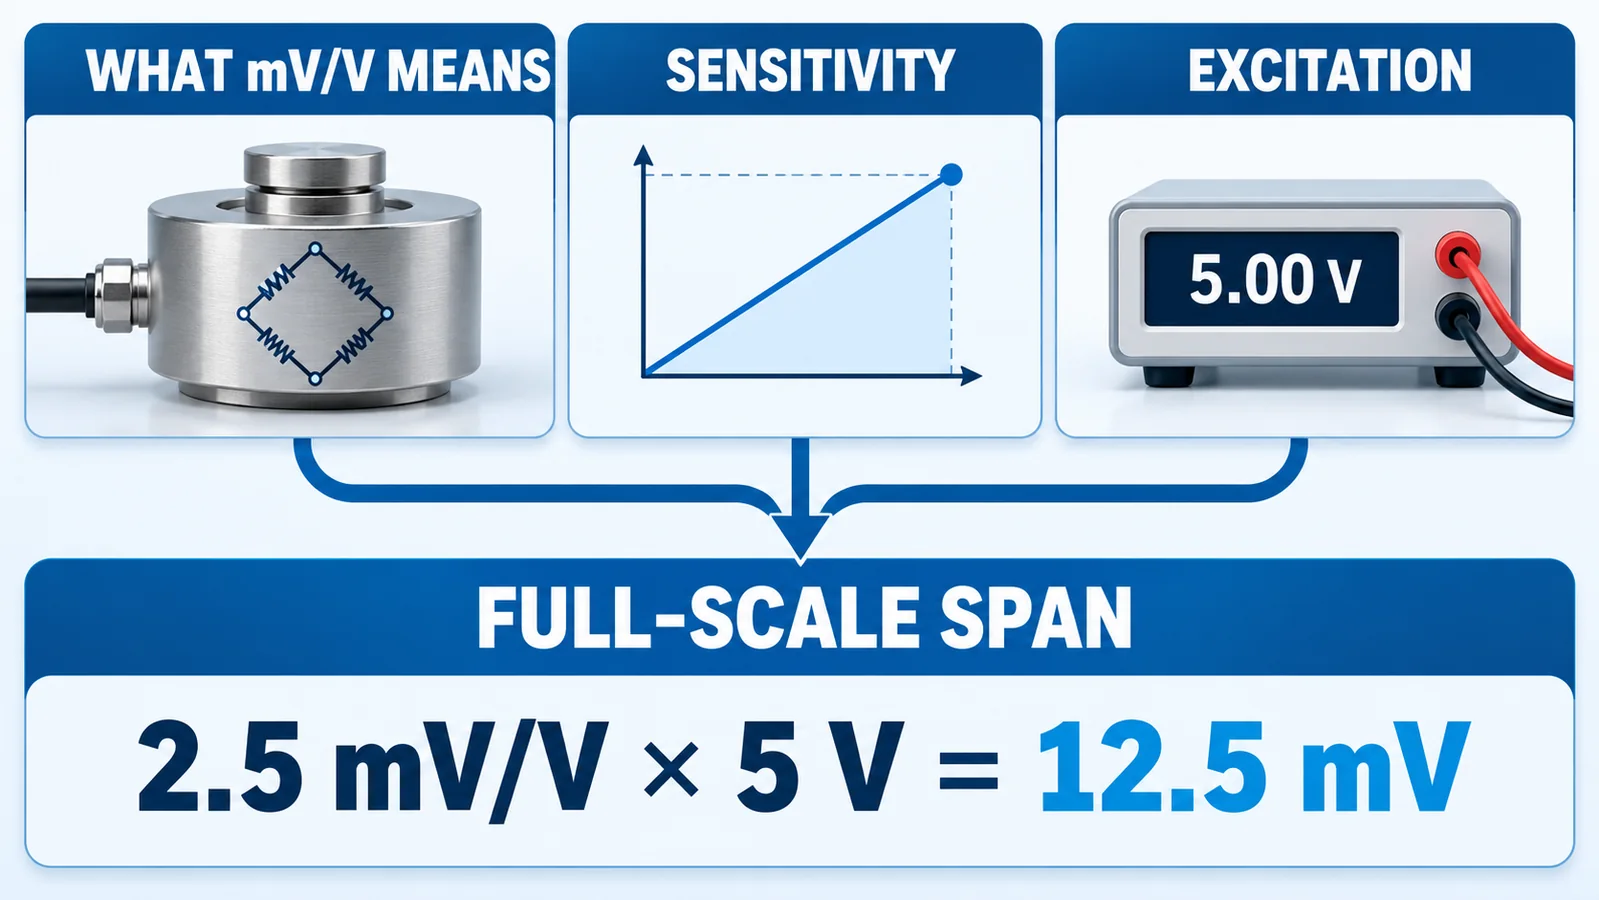
nominal full-scale span (mV) = sensitivity (mV/V) × excitation (V)
For example, a sensor with a nominal sensitivity of 2.5 mV/V excited at 5 V produces a nominal full-scale span of 12.5 mV. That is not yet a 0–5 V controller signal. It is a low-level bridge signal that normally needs differential amplification, filtering, analog-to-digital conversion and calibration.
The important engineering task is therefore not only reading the mV/V number. It is designing the complete signal path around the sensor’s allowed excitation, offset, sensitivity tolerance, common-mode voltage, temperature behavior and worst-case pressure range.
What Does mV/V Mean on a Pressure-Sensor Datasheet?
mV/V means millivolts of output per volt of electrical excitation, normally for a stated pressure span and under stated test conditions. It is a ratio, not a standalone output voltage.
If a bridge has a nominal sensitivity S, excitation VEX and pressure fraction p from zero to full scale, a simplified ideal relationship is:
VDIFF ≈ VZERO + S × VEX × p
unde VDIFF este OUT+ − OUT− şi VZERO is the real bridge output at the defined zero-pressure condition. The sign depends on port pressure and wiring polarity.
This simplified expression is useful for sizing electronics, but a real transfer function also includes non-linearity, hysteresis, repeatability, thermal shift and calibration error. The mV/V value is sensitivity; it is not automatically the sensor’s accuracy.
Rated output, sensitivity and full-scale output are related but not identical
Datasheets may use “rated output,” “sensitivity,” “span” or “full-scale output.” Read the definition and test condition rather than treating the words as interchangeable. Some raw bridge products are specified directly in millivolts under a defined constant-current or constant-voltage excitation. Others are characterized in mV/V.
For example, the official Winsen WPAH01 page lists 1.5–4 mV/V sensitivity and a typical value of 2.5 ±1.0 mV/V. The WPAK63, by contrast, is documented with range-dependent full-scale millivolt output under specified excitation options. Do not transfer the WPAH01 mV/V number to WPAK63.
Why Is the Output Differential?
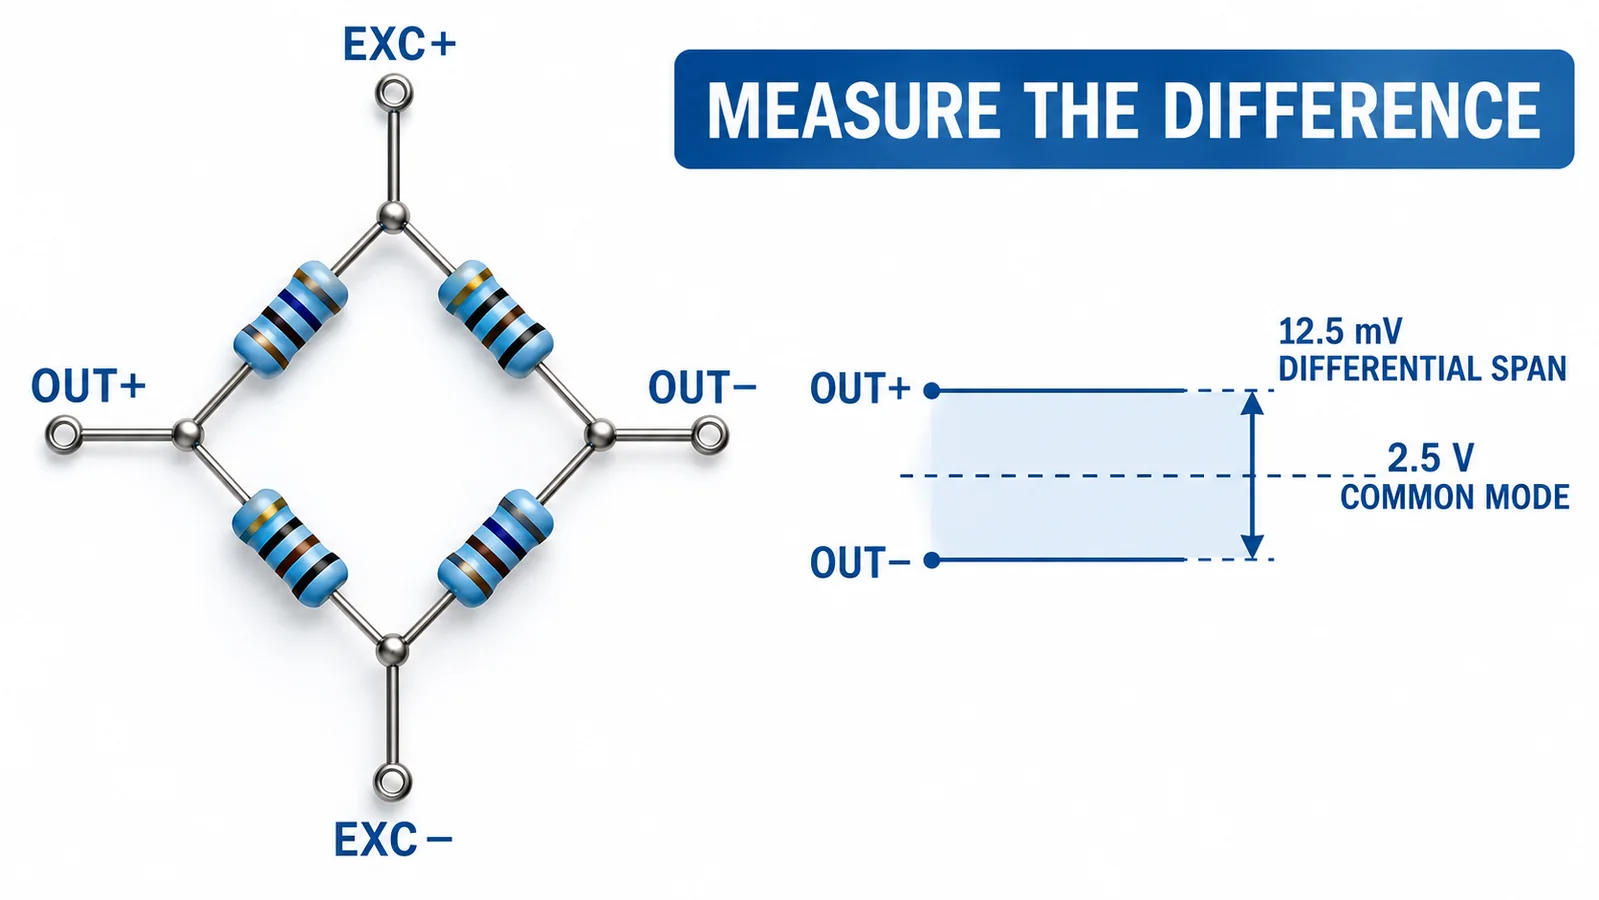
A common piezoresistive pressure element uses four resistive elements in a Wheatstone bridge. Excitation is applied across EXC+ şi EXC−; the useful signal is measured between OUT+ şi OUT−.
In an ideal balanced bridge, both output nodes may sit near half the excitation voltage while their difference is near zero. With 5 V excitation, for example, OUT+ şi OUT− may each be near 2.5 V, yet pressure may change their difference by only a few millivolts. The exact common-mode level and output behavior depend on the sensor.
Do not read only one output node
A single-ended measurement from OUT+ to ground includes the large common-mode level and loses the intended bridge subtraction. Use a differential input or an approved signal-conditioning circuit. The front end must accept both the required differential range and the input common-mode range.
The Pressure Sensor Wheatstone Bridge guide explains the resistor network in more detail. For electronics integration, the practical point is simple: characterize EXC+, EXC−, OUT+, OUT− and the differential voltage, not just one pin relative to ground.
How Do You Calculate the Sensor Span?
Assume a hypothetical 0–10 bar sensor with:
- nominal sensitivity: 2.5 mV/V;
- allowed excitation selected for the design: 5.0 V;
- nominal zero-pressure differential output: treated as 0 mV for the first calculation.
Then:
2.5 mV/V × 5.0 V = 12.5 mV nominal full-scale span
At an ideal 40% of range:
12.5 mV × 0.40 = 5.0 mV above the calibrated zero
For a linear conversion after calibration:
pressure = (VDIFF − VZERO) / calibrated span × full-scale pressure
The calculation should use measured calibration coefficients when accuracy matters. If actual zero is 0.6 mV and the measured full-scale output is 13.2 mV, the calibrated span is 13.2 − 0.6 = 12.6 mV, not the nominal 12.5 mV.
Design with tolerance, not only the typical value
The WPAH01 page’s typical 2.5 ±1.0 mV/V statement illustrates why nominal gain alone is insufficient. With 5 V excitation, that sensitivity interval corresponds to a nominal calculation from 7.5 to 17.5 mV full-scale span before considering zero output and other errors. The exact ordered product and current documentation must be confirmed, but the design lesson is general: an analog front end must accommodate production variation without clipping or losing excessive ADC resolution.
What Blocks Are Needed Between the Bridge and the MCU?
A typical embedded measurement path contains:
- a stable bridge excitation source;
- input protection appropriate to the electrical environment;
- a high-input-impedance differential or instrumentation amplifier;
- an analog low-pass and anti-alias filter;
- an ADC with a suitable input range and reference;
- digital conversion from counts to pressure;
- zero, span and temperature calibration coefficients;
- diagnostics for open wires, saturation or implausible values where required.

Each block can add offset, gain error, noise or temperature drift. A 16-bit ADC does not create 16 bits of accurate pressure data if the amplifier noise, reference drift or sensor error dominates the lower bits.
Sensor core or conditioned transmitter?
A raw bridge gives the OEM control over the analog chain, packaging and calibration, but it also transfers those responsibilities to the OEM. A conditioned module or transmitter reduces analog design work and may provide voltage, current or digital output. The sensor-core-versus-transmitter guide helps define that make-or-buy boundary.
How Do You Choose an Instrumentation Amplifier?
The amplifier must resolve a small differential signal while rejecting the common-mode signal present on both bridge outputs. Review at least the following parameters under the real supply and temperature conditions:
| Requirement | De ce contează |
|---|---|
| Input common-mode range | Both bridge outputs may sit near mid-excitation |
| Input offset and offset drift | Input microvolts become output millivolts after high gain |
| Bias current and bridge impedance | Bias-current imbalance can create input error |
| CMRR across frequency | Supply and coupled interference can appear as common mode |
| Gain accuracy and drift | Directly affects span calibration between calibration points |
| Input noise | Limits usable resolution, especially at low bandwidth |
| Output swing and load | Determines whether the ADC range can be reached without clipping |
| Bandwidth and settling | Must support the pressure dynamics and multiplexing strategy |
| Input protection and recovery | Faults should not create long recovery or damage |
The analog front end described in an Analog Devices bridge-measurement article demonstrates why offset, gain, common-mode rejection and noise must be evaluated together. A part number or nominal gain alone is not a complete design.
How Much Gain Should You Use?
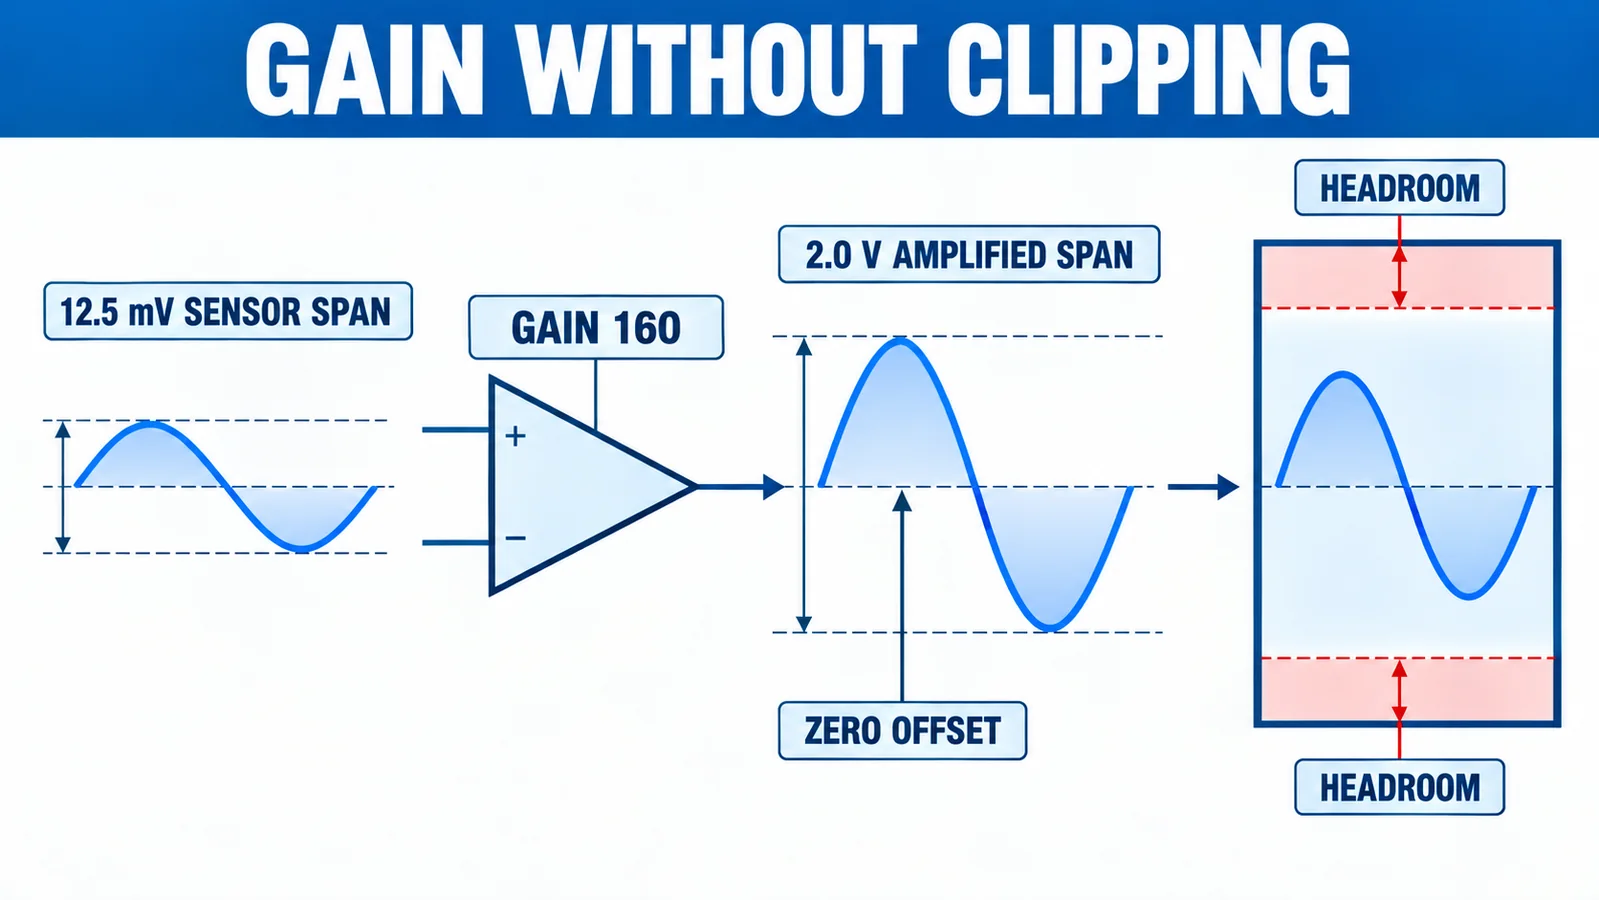
Choose gain from the worst-case input envelope and ADC limits. Suppose the nominal bridge span is 12.5 mV and an initial design uses gain 160:
12.5 mV × 160 = 2.0 V nominal amplified span
That may fit well inside a 3.3 V ADC input, but only after checking:
- maximum sensor sensitivity rather than typical sensitivity;
- maximum zero offset at minimum and maximum temperature;
- amplifier input and output offset;
- pressure overrange that the electronics must survive or report;
- positive and negative measurement direction;
- ADC reference tolerance and input headroom;
- amplifier output swing under the selected load.
Offset placement for unipolar ADCs
A bidirectional bridge signal can become negative relative to its zero. A unipolar ADC cannot digitize a voltage below ground. A designer may add an output reference, for example mid-supply, so zero pressure maps to a positive ADC code and positive/negative pressure moves above or below it. That reference becomes part of the error and drift budget.
Do not automatically amplify until the nominal full-scale value touches the ADC rail. Headroom makes room for tolerance, calibration, overrange and fault detection.
What Is Ratiometric Pressure Measurement?
For a voltage-excited bridge, output span ideally changes in direct proportion to excitation. If the ADC reference is derived from the same excitation, the ADC conversion can cancel the first-order effect of excitation change:
ADC ratio ∝ VOUT / VREF
When both numerator and reference track the same supply, the ratio can remain stable even if that supply changes slightly.
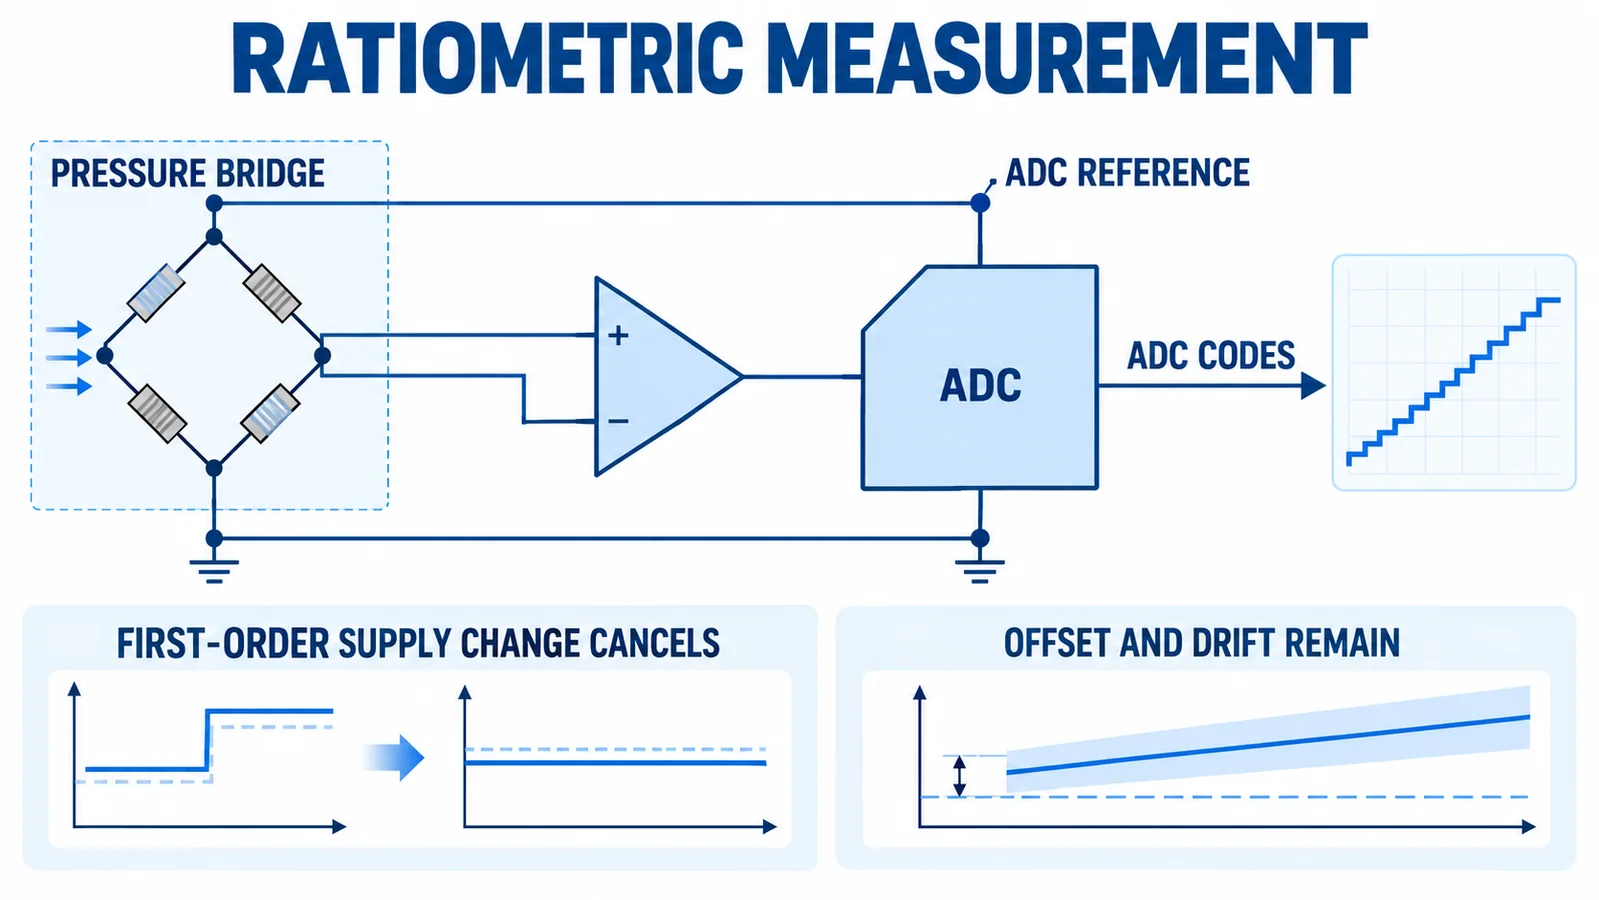
Ratiometric conversion does not remove zero offset, sensitivity tolerance, non-linearity, thermal effects, amplifier offset, reference-routing error or ground differences. It also requires the ADC reference and bridge excitation to track at the relevant point, including cable drop and filtering. The NI explanation of mV/V iar cel LabJack application note provide useful background on ratio-based bridge measurement.
How Should the Signal Be Filtered and Wired?
Start with the required measurement bandwidth. A hydraulic transient recorder and a slow tank-pressure monitor need very different filters. The analog low-pass filter should limit noise and aliasing without masking the response that the system must detect. Digital averaging can reduce random noise, but it cannot repair clipping, ground offset or poor analog common-mode behavior.
For wiring and PCB layout:
- keep high-impedance amplifier inputs short and symmetrical;
- route bridge outputs as a differential pair away from switching nodes;
- decouple excitation and analog supplies at the required locations;
- separate high-current returns from the low-level analog return;
- use shielding only with a documented termination strategy;
- avoid unintended ground loops between sensor housing, cable shield and controller;
- verify connector pin assignments from the exact ordered datasheet, not wire color assumptions.
Long cable runs increase susceptibility to noise, resistance and surge. If the sensor is remote from the electronics, consider whether a conditioned voltage, current-loop or digital transmitter is more appropriate than carrying raw millivolts through the machine.
How Do You Calibrate the Complete Measurement?
Calibration maps the assembled system—not only the sensor—to pressure. A practical production process can include:
- stabilize the assembly at the specified temperature and supply;
- record zero-pressure differential output and ADC code;
- apply one or more traceable pressure points;
- calculate span or a higher-order fit only if the data justify it;
- verify decreasing-pressure points if hysteresis matters;
- repeat at relevant temperatures for compensation;
- store coefficients with version and traceability data;
- run an independent verification cycle after coefficients are written.
Two-point calibration corrects system zero and span at the calibration condition. It does not erase non-linearity, hysteresis, repeatability or temperature dependence. The accuracy target should be evaluated using an error budget consistent with the full-scale-versus-reading guide.
Why Is the Reading Wrong or Unstable?
| Simptom | First measurements | Likely categories |
|---|---|---|
| Output is fixed near zero | Excitation across EXC pins; continuity; differential mV under pressure | Wrong pinout, open bridge, no pressure path, incorrect reference |
| ADC is saturated | OUT+/OUT− common mode; differential mV; amplifier output | Too much gain, excessive offset, wrong amplifier range or overpressure |
| Pressure direction is reversed | Port pressure and OUT polarity | Swapped output leads, wrong port definition or sign in firmware |
| Reading shifts with supply | Excitation and ADC reference at the same time | Non-ratiometric design, cable drop, reference mismatch or supply coupling |
| Reading is noisy | Raw differential signal, amplifier output and spectrum | EMI, ground path, excess bandwidth, source impedance or reference noise |
| Units are wrong by a constant factor | Calibrated span, ADC scale, pressure range | mV/V conversion error, gain error, wrong full-scale range or unit conversion |
| Zero changes after assembly | Mechanical mounting, seal force and temperature | Package stress, diaphragm loading, temperature or calibration sequence |
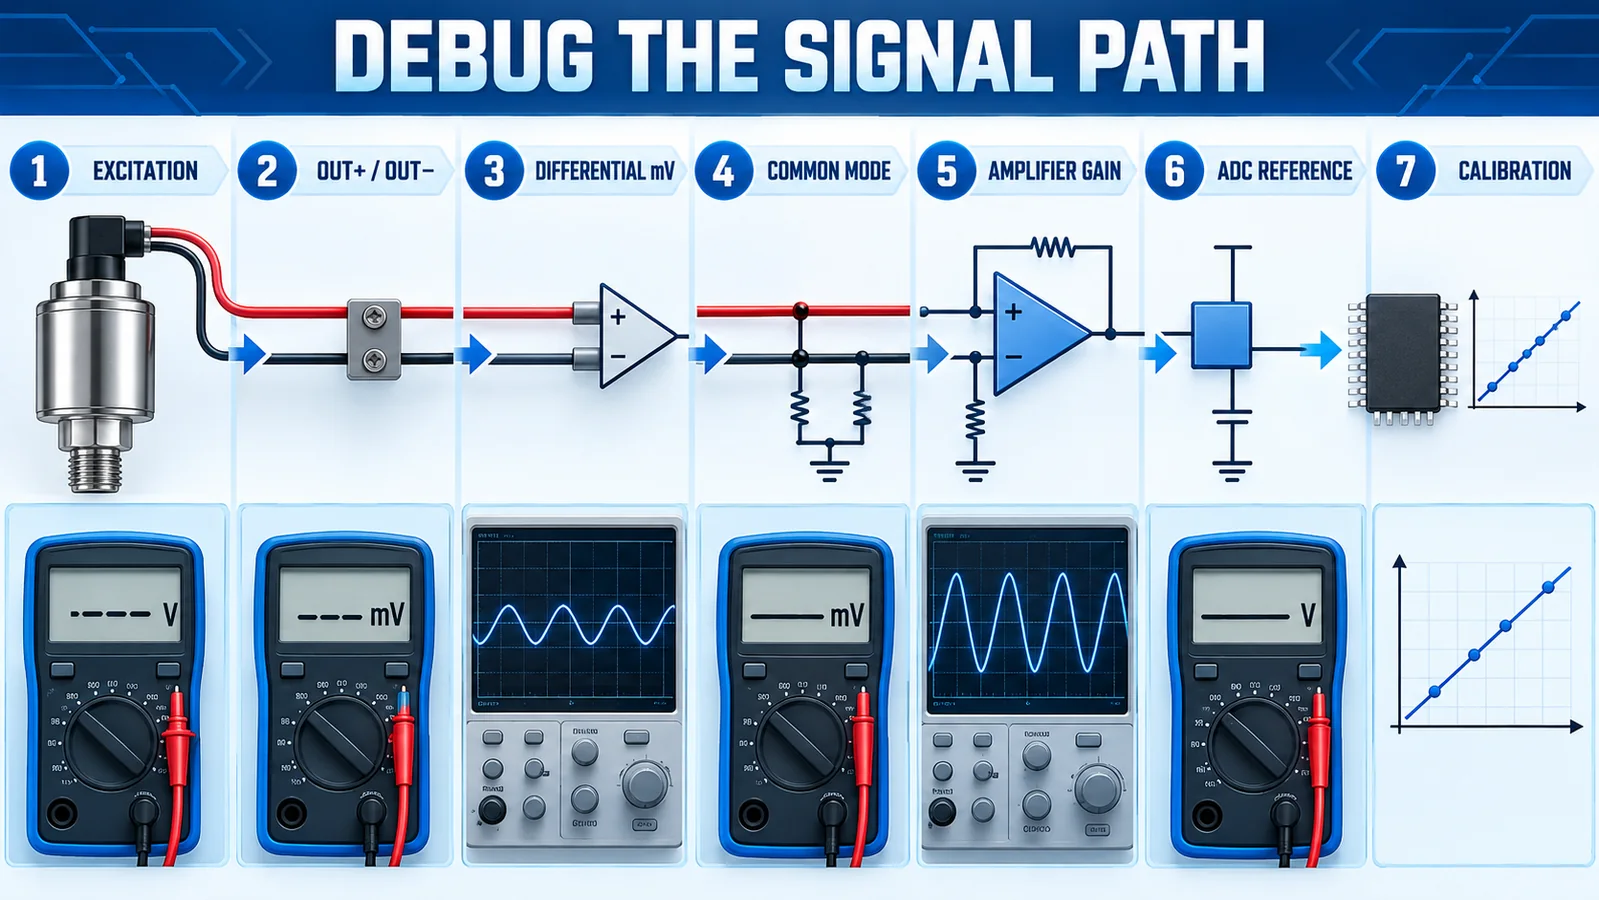
Measure each stage with a known pressure before editing coefficients. A firmware multiplier cannot correct an amplifier that is saturated or a bridge wired to the wrong terminals.
How Do WPAH01 and WPAK63 Fit an OEM Design?
| Model | Verified interface facts | OEM responsibility |
|---|---|---|
| WPAH01 | Ceramic piezoresistive core; 2–20 V working voltage; 1.5–4 mV/V sensitivity with 2.5 ±1.0 mV/V typical statement on the current product page | Mechanical packaging, seal and preload; excitation; differential front end; calibration; temperature validation |
| WPAK63 | Isolation-film raw pressure core with 316L diaphragm/housing and range-dependent mV output under documented excitation choices | Confirm exact range, pressure reference, excitation option, output span, media and seal; design amplifier and calibration around that variant |
These products are not interchangeable solely because both provide low-level bridge output. Select by medium, pressure reference, range, mechanical integration, wetted materials, excitation method, temperature performance and production-calibration plan.
What Should an OEM RFQ Specify?
Provide Winsen with:
- pressure range, reference and permitted overpressure;
- medium, wetted-material and seal requirements;
- operating and compensation temperature ranges;
- required accuracy definition and calibration points;
- preferred constant-voltage or constant-current excitation;
- target raw span or conditioned output;
- allowable package stress and mounting geometry;
- electronics supply, ADC range, sample rate and required bandwidth;
- annual volume, traceability and change-control requirements.
For a new design, request the current variant-specific datasheet and sample-lot characterization before freezing amplifier gain or calibration limits. Contactați Winsen with the application envelope rather than only a pressure range.
Întrebări frecvente
Is 2 mV/V the same as 2 mV output?
No. A 2 mV/V sensor produces a nominal 2 mV per volt of allowed excitation at the stated condition. At 5 V excitation, that calculation gives 10 mV nominal full-scale span.
Can an MCU ADC read mV/V directly?
Usually not with useful resolution and accuracy. The bridge output is small and differential, often with a substantial common-mode voltage. A suitable differential ADC or instrumentation-amplifier front end is normally required.
Does higher excitation always improve resolution?
Higher excitation increases voltage output for a voltage-driven bridge, but it can also increase self-heating and may exceed the sensor limit. Use only the excitation range and test condition specified for the exact sensor.
What amplifier gain should I choose?
Choose gain so the worst-case sensor span, zero offset, temperature shift and required overrange fit inside the amplifier and ADC limits with headroom. Do not size gain from typical sensitivity alone.
Is mV/V output automatically ratiometric?
The bridge span is normally proportional to excitation under the stated voltage-drive model. The complete measurement becomes ratiometric only when the ADC reference and signal path are designed to preserve that ratio.
Why is the zero-pressure output not zero volts?
Real bridges have zero offset, and both output nodes often sit at a common-mode voltage. Calibrate the differential zero within the model’s published limits; do not expect either output pin to be at ground.
Turn Millivolts into Reliable Pressure Data
An mV/V sensor can give an OEM a compact, flexible and cost-effective pressure interface, but it is only one part of the measurement system. Calculate the nominal span, then design for the full tolerance envelope, differential common mode, ADC headroom, temperature behavior and production calibration. That is the path from an attractive bench reading to repeatable pressure data in real equipment.
