

Measure individual line pressures to track how well the circuit stays pressurized, supply-to-return differential pressure (ΔP) to assess the pressure available to drive flow, and upstream-to-downstream ΔP to monitor restrictions such as filters. Label each reading by circuit and tap location. A normal differential at the coolant distribution unit (CDU) can coexist with low flow at a rack. To diagnose a change, compare pressure with flow, supply and return temperatures, and the operating state at the same time.
Where pressure is measured in a CDU system
In a liquid-to-liquid CDU, the facility water system (FWS) brings cooling to the heat exchanger, and the technology cooling system (TCS) circulates coolant between the CDU and the IT equipment. The fluids exchange heat through the exchanger while staying in their respective circuits. Draw both circuits on the tap map before naming tags or configuring a differential. The two sides of the heat exchanger serve different hydraulic systems.
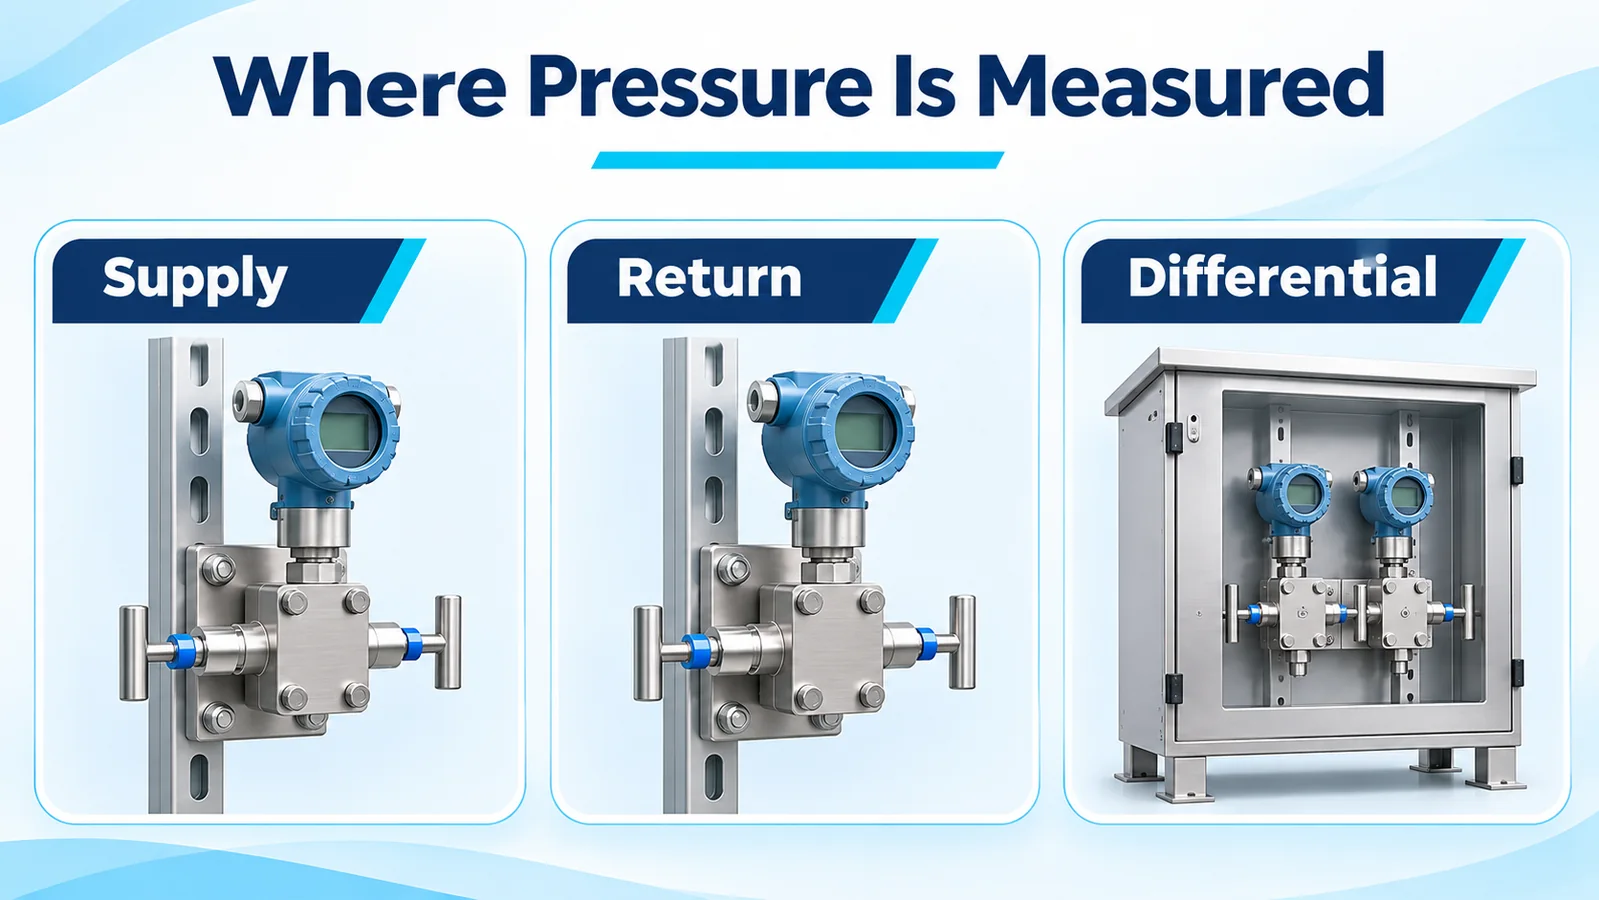
| Tap or tap pair | Misurazione | What it helps an operator check |
|---|---|---|
| TCS return at the CDU | Individual line pressure | Pressurization at that location, with the pump state and reference elevation recorded |
| TCS supply and return at the CDU boundary | Supply minus return | Pressure between the defined CDU connections and, where specified, the pump control variable |
| TCS supply and return at a distribution header or selected rack | Local supply minus local return | Pressure available at that location under the observed demand |
| FWS supply and return at the CDU boundary, if instrumented | Facility supply minus facility return | Pressure between the facility connections, including the effect of intervening equipment and valve position |
| Immediately upstream and downstream of a filter | Upstream minus downstream on the same circuit | Pressure loss across the filter assembly at the measured flow |
Mark the exact extent of a measurement on the piping and instrumentation diagram. If an isolation valve, hose or fitting sits between the two taps, its loss contributes to the measured difference. Record the pressure reference, units, which side is subtracted, and the tap elevation. In the Vertiv CoolChip CDU 600 planning guide, for example, the secondary differential uses the TCS supply and return readings, while the primary filter differential uses a separate pair across the FWS filter. Vertiv CoolChip CDU 600 Application and Planning Guide, Appendix C
Compare distribution pressure at the CDU, header and rack
As coolant flows through the supply and return piping, pipes, valves and fittings consume pressure head. A rack farther along the distribution system can therefore see less supply-to-return ΔP than the CDU reports. The lowest-margin rack can also change as branches open or close, so choose representative monitoring locations from the hydraulic design and commissioning results. Draw each paired measurement at the same system boundary. For a rack connection, take the reading between that rack’s supply and return connection points and document whether the pair includes the branch valves or manifold.
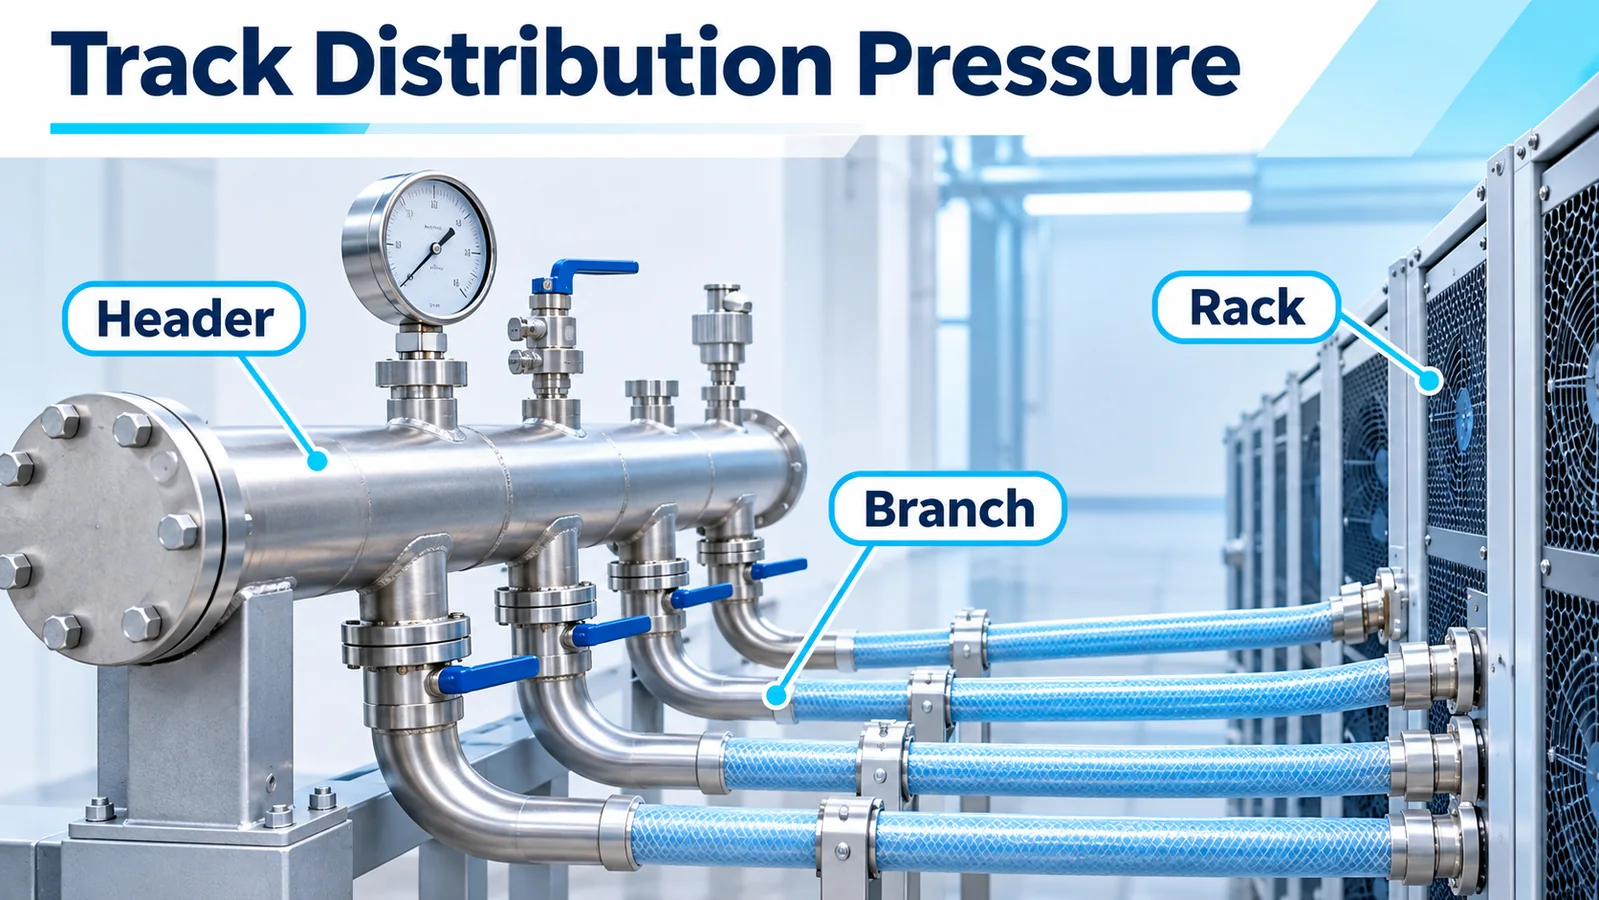
Suppose the CDU reports a 70 kPa TCS differential while a remote rack connection reads 35 kPa at the same instant. With matched pressure references and negligible elevation and velocity-head effects, the 35 kPa difference represents the combined pressure loss along the distribution path between those measurement boundaries under that operating condition. The rack still has 35 kPa between its connections. Compare that value with the pressure needed to deliver the rack’s design flow, then check its actual flow or the manufacturer’s branch pressure-drop data. Apply any elevation correction required by the installation before comparing pressure head between taps at different heights. Water distribution pressure sensor placement
Record which differential the pump controller actually regulates. A local control loop may hold the CDU reading as the system adds racks or changes flow. A remote measurement can then show whether that local target still leaves adequate pressure at the index rack, the rack with the least hydraulic margin under the current conditions. Keep the controller’s measurement and the verification point visible as separate tags. When reviewing a low-flow incident, use the matching pump command, pump status and branch valve position to interpret both trends.
Diagnose filter restriction with a flow-matched baseline
Take filter ΔP from taps that bracket the filter. Establish a clean-filter curve or baseline across the flow range the unit typically sees. A single reading at one pump speed leaves little context when branch demand changes or another pump takes over. Higher flow can raise ΔP through a clean filter. Low flow can keep the measured pressure drop modest even when the filter is fouled. Coolant temperature and composition can change viscosity, so compare readings under similar conditions or account for fluid properties when using a reference curve.
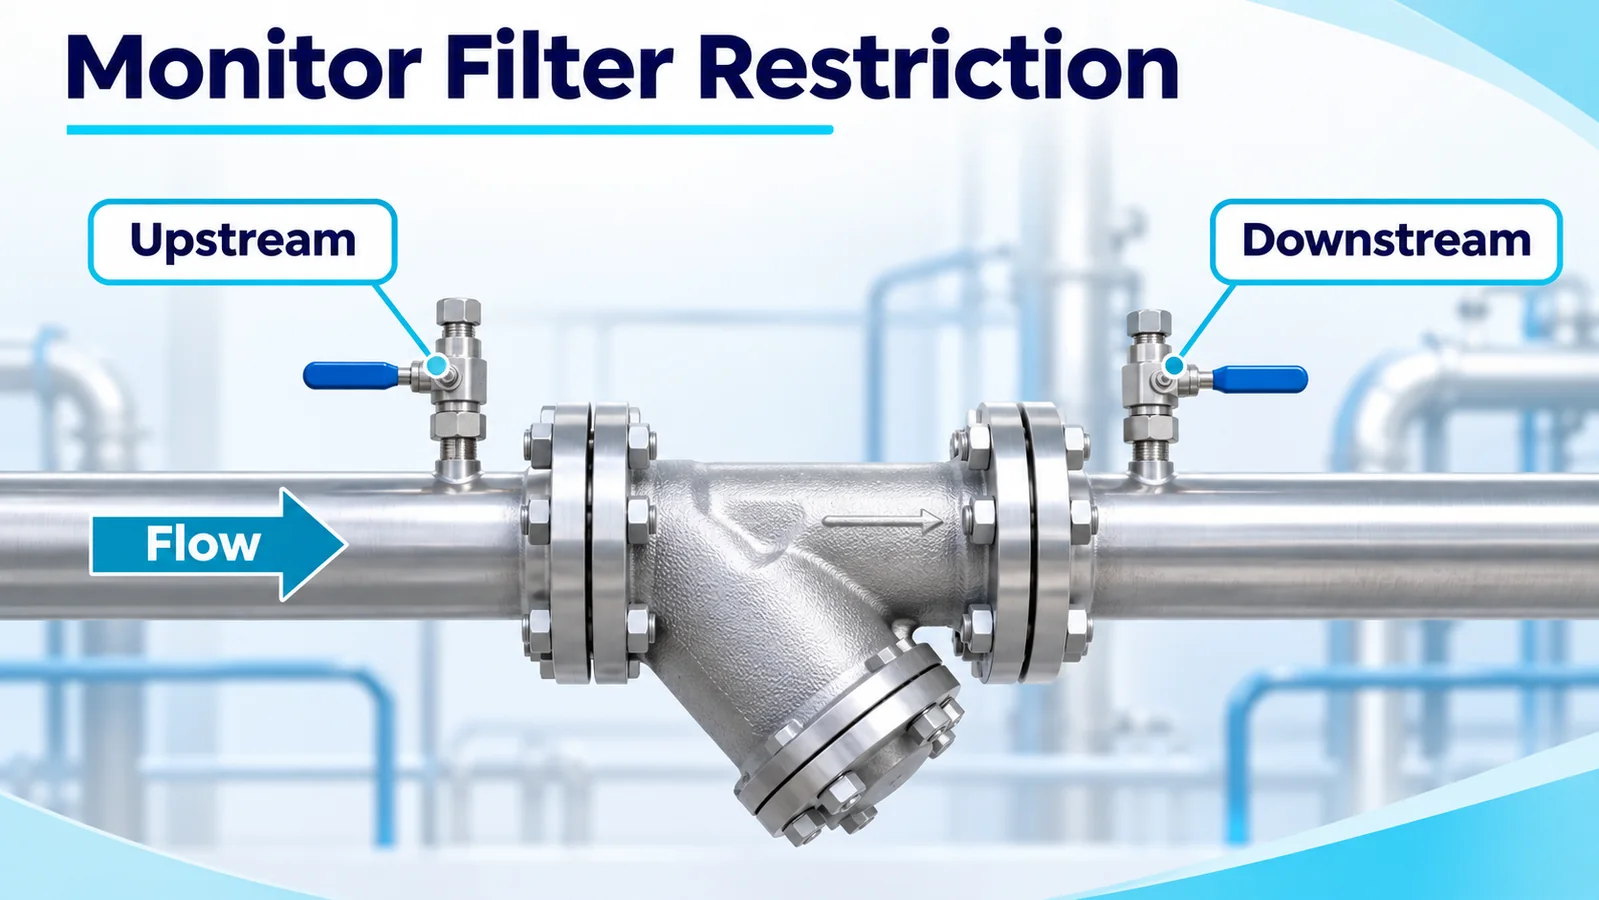
If the filter differential rises at comparable flow and coolant temperature, confirm the tap readings and compare with the filter manufacturer’s service criterion. Check which pump and filter path is active when the CDU has parallel paths. For a heat exchanger, define a separate pair across the side being monitored and evaluate changes against the expected pressure drop for that side and flow. A loss of thermal performance can also justify comparing exchanger temperatures and flow even when the measured pressure drop holds steady. The CDU 600 guide specification illustrates separate differential monitoring of the TCS and FWS filter assemblies. Vertiv CoolChip guide specifications, section 2.3
Select the transmitter for the pressure point
Specify a data center CDU pressure sensor from the conditions at its tap. Document normal and maximum line pressure, the pressure reference, expected transients, the smallest useful signal change, and permitted installed error. For a dedicated differential transmitter, specify the ΔP span and the allowable static line pressure at both ports, along with the allowable one-sided overload during isolation, filling or servicing. For two single-point transmitters, size each for its own line pressure and budget the combined error against the smallest useful differential. Check exposure during valve movement and pump transitions against the ratings for the transmitter and connection. Water hammer and pressure sensor protection
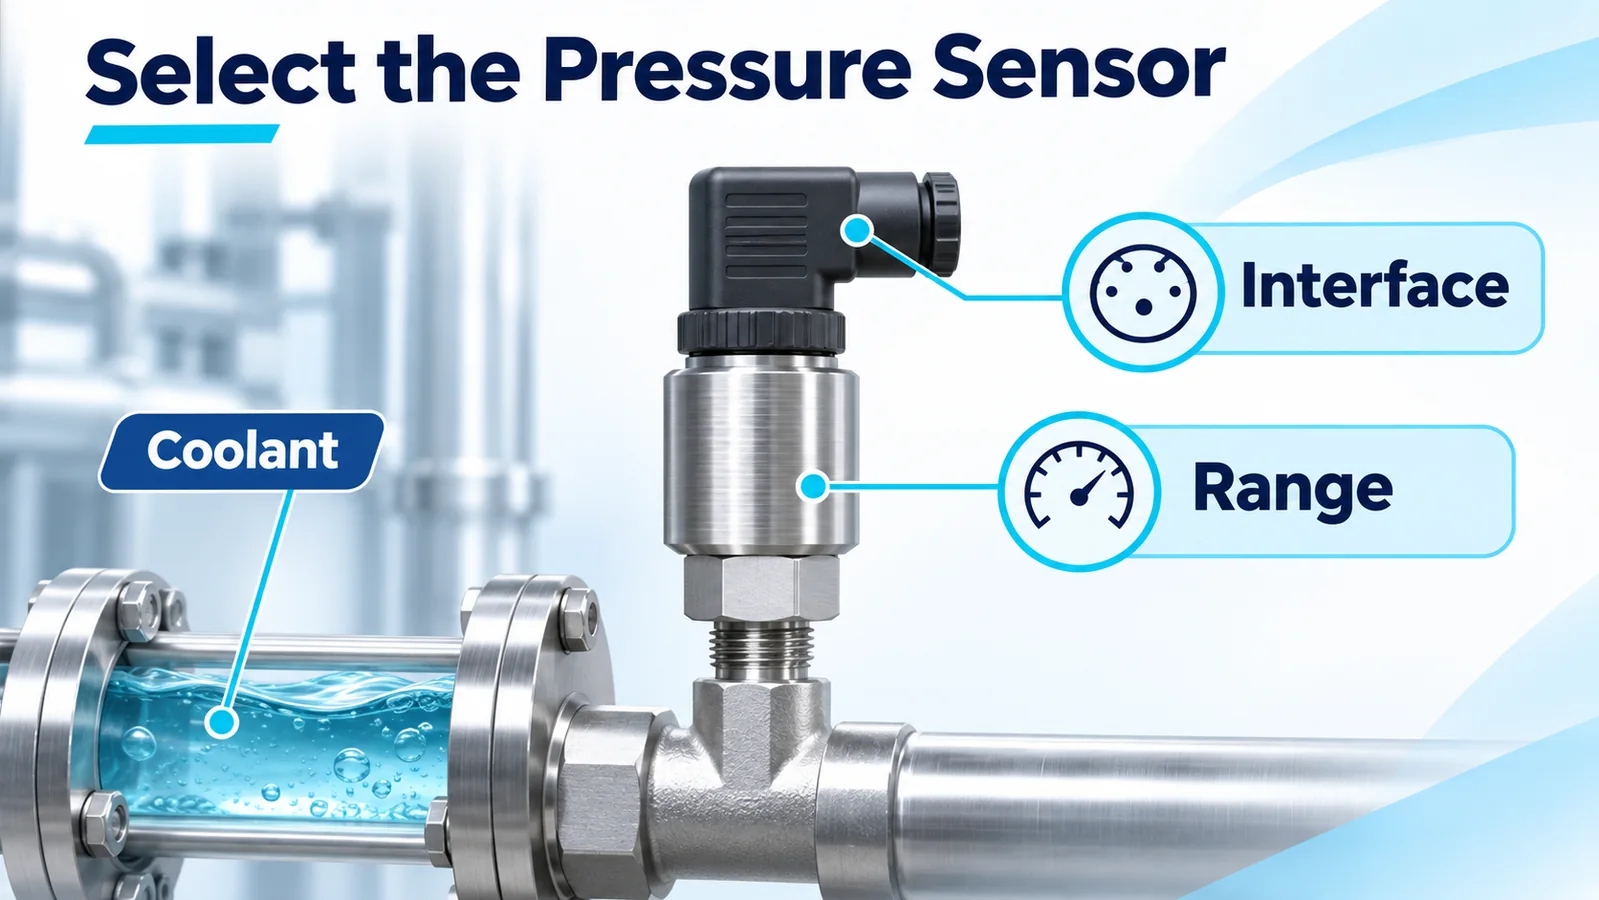
Confirm compatibility of the diaphragm, process connection and any wetted seals with the actual coolant, inhibitor package and operating temperature. Check the thread and sealing method, service clearance, condensation exposure and electrical interface at the installed location. Include the receiver’s input range and scaling in the specification. Pressure sensor wetted materials
Winsen presents WPCK07 as a candidate for pressure points inside the CDU and WPCK16 as a candidate for external facility-side piping in its liquid-cooling application note. Both are diffused-silicon transmitters for individual pressure points. If the controls calculate a differential from two units, verify performance as an installed pair. Request the configured range, reference, process connection, wetted materials and output for the intended variant before specifying either model. Winsen liquid-cooling application note · WPCK07 product page · WPCK16 product page
Interpret the two readings behind a differential
Subtract the return pressure from the supply pressure using the same units, reference and time basis. Consider a supply at 400 kPa gauge and a return at 380 kPa gauge. The differential is 20 kPa. If the lines later read 500 and 480 kPa gauge, respectively, ΔP still reads 20 kPa. The common-mode rise of 100 kPa is visible only in the individual readings in this example. Those readings let an operator check each line against its own operating limits while still tracking the pressure difference that drives flow.
Now suppose each of two hypothetical 0–1,000 kPa sensors can contribute ±5 kPa of installed error. The worst-case error in their difference is ±10 kPa when the sensor errors are in opposite directions. At a true 20 kPa differential, an indicated value could range from 10 to 30 kPa under that error assumption. Equal offsets cancel in the subtraction, but mismatched offsets, temperature drift or unsynchronized response can create a false differential. For a narrow filter ΔP on high-pressure lines, consider whether a suitably rated low-span differential transmitter meets the uncertainty requirement more readily. Banda di errore totale del sensore di pressione
Read the pressure in the context of the event. Falling rack flow with steady CDU ΔP directs attention toward branch conditions, including valve position, local restrictions and the rack’s own differential. A rising filter ΔP at comparable flow and temperature is consistent with increasing restriction. If rack inlet temperature rises while pressure and flow look steady, compare TCS supply and return temperatures at the CDU, FWS supply temperature and flow, and recent changes in IT load. Pressure describes the hydraulic conditions at its taps. Flow and temperature together help explain how much heat the coolant can carry away. Texas Instruments application brief on monitoring liquid-cooled servers and CDUs
Commission the measurement before using it for alarms
Walk the tap map with the equipment vendor’s commissioning procedure and the site’s point list. Verify that the physical tags match what operators see locally and in the building management system. Confirm the circuit, tap boundary, sign convention and unit conversion with a reference suited to the span. Record the equipment configuration used for each test so later comparisons reproduce the relevant flow path. Vertiv CoolChip CDU 600 Installation and Commissioning Guide, section 6

- Verify the installed connections. Confirm isolation valve positions, impulse-line routing if used, tap elevations, appropriate venting and the approved fill condition. Inspect for trapped air or blocked taps that could delay or bias a reading.
- Check the individual signals and the differential. Verify scaling at the controller and supervisory display. Use an approved equal-pressure check where the hardware permits it, then verify the direction and magnitude of a known differential. Preserve the underlying line pressures in the historian.
- Capture baselines across operating modes. Record fill pressure under the specified pump-off conditions. With circulation established, log CDU and rack differential pressures with filter ΔP, flow, temperatures, pump state and relevant valve positions at representative loads. Record normal behavior during approved pump changeovers or demand changes.
- Test alarm response and invalid inputs. Use permitted simulations or commissioning steps to check the alarm threshold, delay, reset and the response to a failed or stale channel. Keep unavailable data distinct from a valid zero differential. Set limits using the equipment and rack requirements, measured baselines, and the site’s control sequence. Pressure sensor installation guide
Domande frequenti
Can the CDU supply-to-return differential substitute for rack flow measurement?
Use the CDU differential to understand the pressure available at the unit boundary. To verify rack flow, use a local flow reading or a validated relationship between rack differential and flow for the known rack configuration. Valve and quick-disconnect positions, coolant properties and restrictions can all affect that relationship.
When can two pressure transmitters replace a differential transmitter?
Two compatible line transmitters can support a calculated differential when their combined installed error, scaling and time alignment suit the decision. This arrangement also keeps both line pressures available for diagnostics. A dedicated differential transmitter can be a better fit for small pressure differences if its static pressure and overload ratings match the application.
What filter pressure drop should trigger service?
Use the filter or CDU manufacturer’s criterion for the installed assembly and check it against the flow and fluid conditions used to define that limit. Trend the reading against the clean baseline so a normal rise caused by increased demand is distinguishable from restriction developing at comparable flow.
