
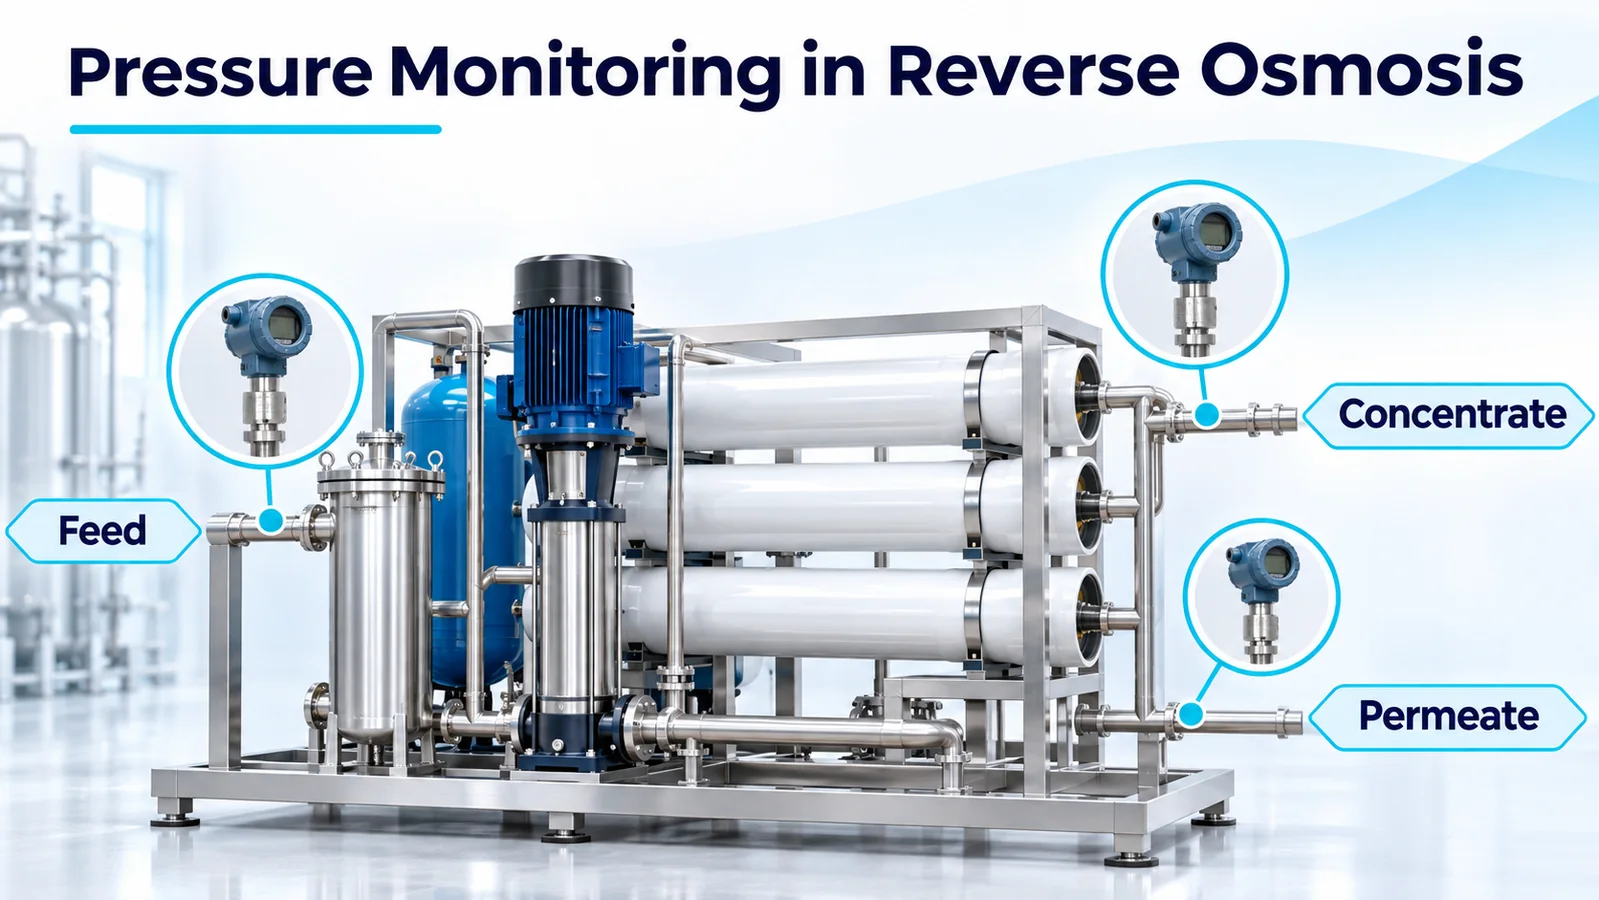
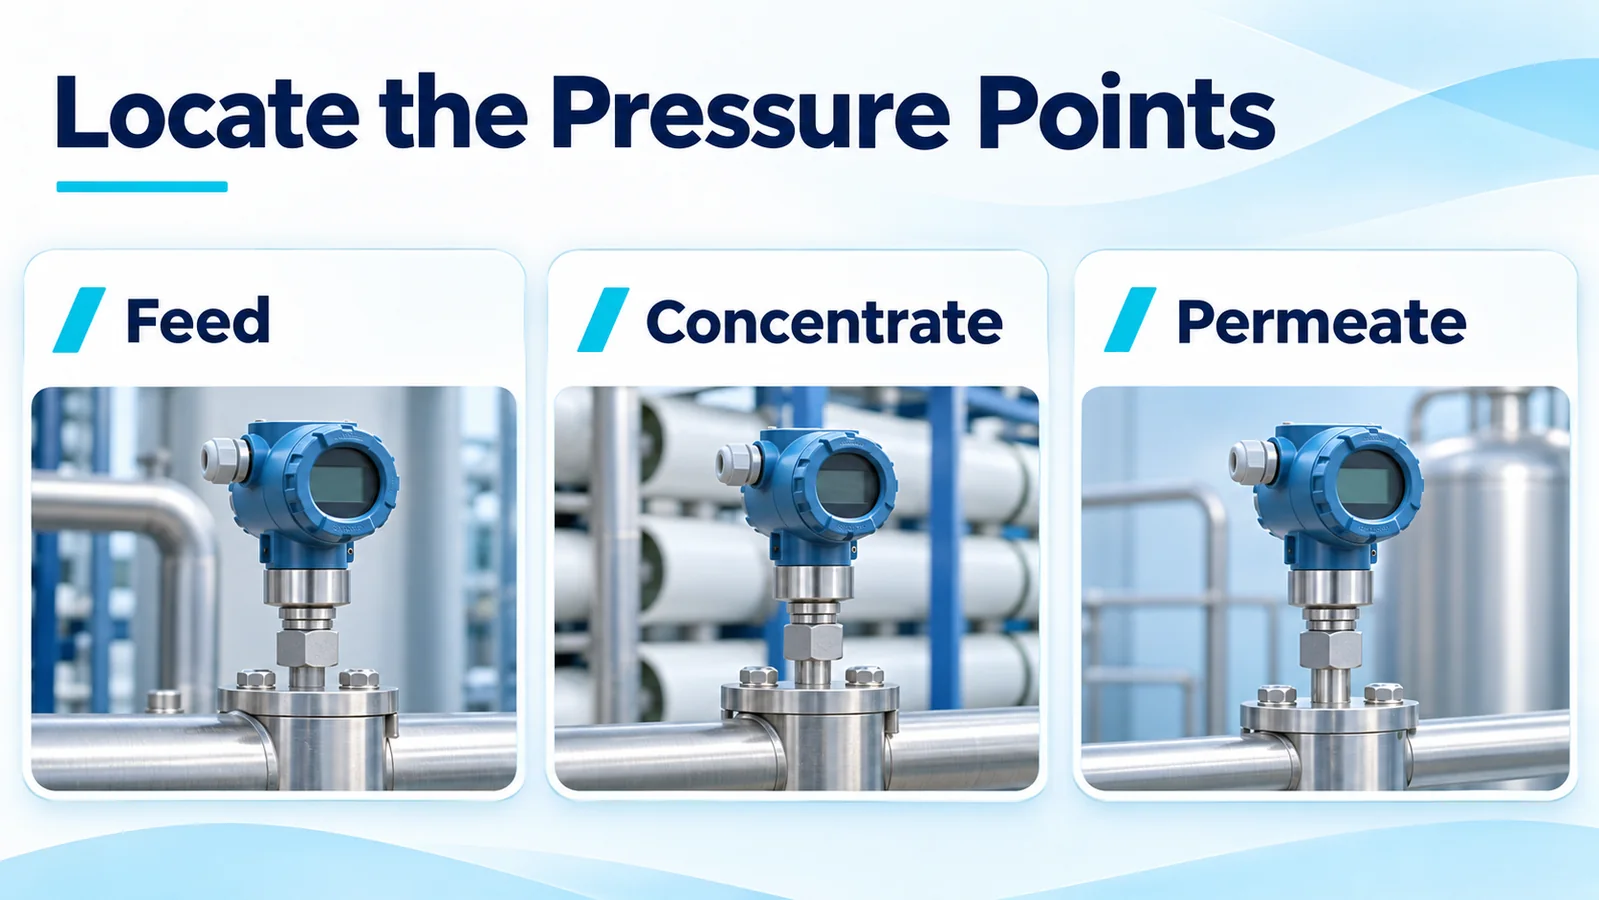
A reverse osmosis pressure sensor measures a particular point or pressure difference on the skid. Measure feed pressure at the membrane inlet, concentrate pressure at the outlet before the concentrate control valve, and permeate pressure at the membrane product outlet where downstream backpressure can reach it. The difference between the feed and concentrate readings is the feed-channel differential pressure (DP). Permeate pressure belongs in a separate calculation that estimates how much pressure is available to drive water through the membrane.
Where should pressure be measured on an RO skid?
Define the measurement boundary before choosing the instrument. A common arrangement for one stage is a high-pressure pump feeding the membrane vessel, a concentrate line leaving the vessel through a control valve, and a permeate line leading to a tank or product header. Put the taps where they represent the pressures acting on the stage. Draw the taps and intervening components on the piping and instrumentation diagram so the control system and the operator interpret the tags the same way.
| Pengukuran | Typical tap location | What the reading tells you |
|---|---|---|
| Membrane feed pressure | Stage inlet, downstream of the pump and any flow-path restrictions upstream of the inlet | Pressure entering the stage |
| Concentrate pressure | Stage outlet, upstream of the concentrate control valve | Pressure remaining at the end of the feed channels |
| Permeate pressure | Product outlet on the membrane side of downstream restrictions or check valves, where practical | Pressure opposing permeate production and any retained pressure during shutdown |
| Pretreatment filter DP | One tap on each side of the cartridge housing | Pressure loss across that filter assembly |
If several stages operate in series, use the inlet and outlet of each stage to locate rising pressure loss. A single whole-train value adds together losses between its taps and can conceal which stage changed. Likewise, pump discharge is a useful pump measurement. If a valve or a long pipe run lies between it and the stage, its reading also includes pressure that is lost before the water reaches the membrane. Plan individual vessel taps when the OEM requires vessel-level diagnosis. DuPont FilmTec RO/NF technical manual, §3.14.5 and §3.17
What does feed-to-concentrate differential pressure show?
Calculate stage feed-channel DP as feed pressure minus concentrate pressure. Use readings taken at the same time, in the same units and on the same reference basis. This difference represents the hydraulic loss between the taps as feed water travels along the membrane channels. With taps at the stage boundaries, it can include short sections of piping and headers. A tap after the concentrate valve also captures the valve’s pressure drop and can make a valve movement look like a membrane problem.
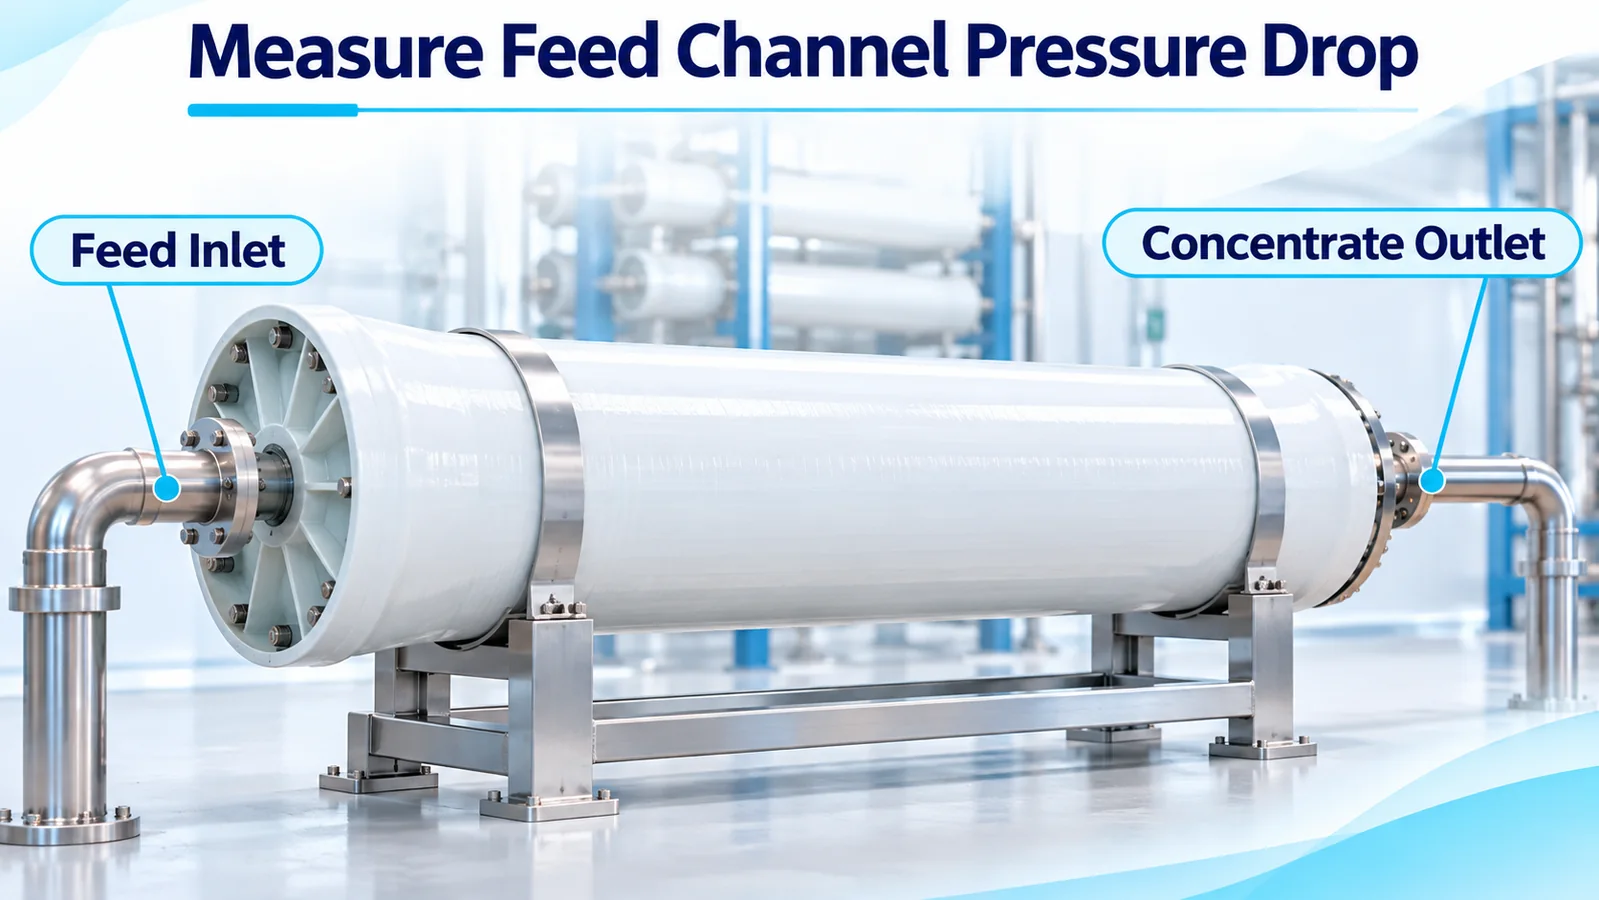
A sustained increase at comparable flow and temperature merits a check for feed-channel restriction. The same channels show higher loss when more water passes through them, and a change in water temperature can also shift the reading. Check whether the flow, number of active vessels, valve position or measurement changed before assigning the increase to plugging. If only one stage shows the change, start the investigation at that stage. Track filter DP independently so a loaded upstream cartridge can be distinguished from a loss within the membrane stage. FilmTec troubleshooting guidance, §8.5.3 · Differential pressure measurement guide
How does permeate backpressure affect driving pressure?
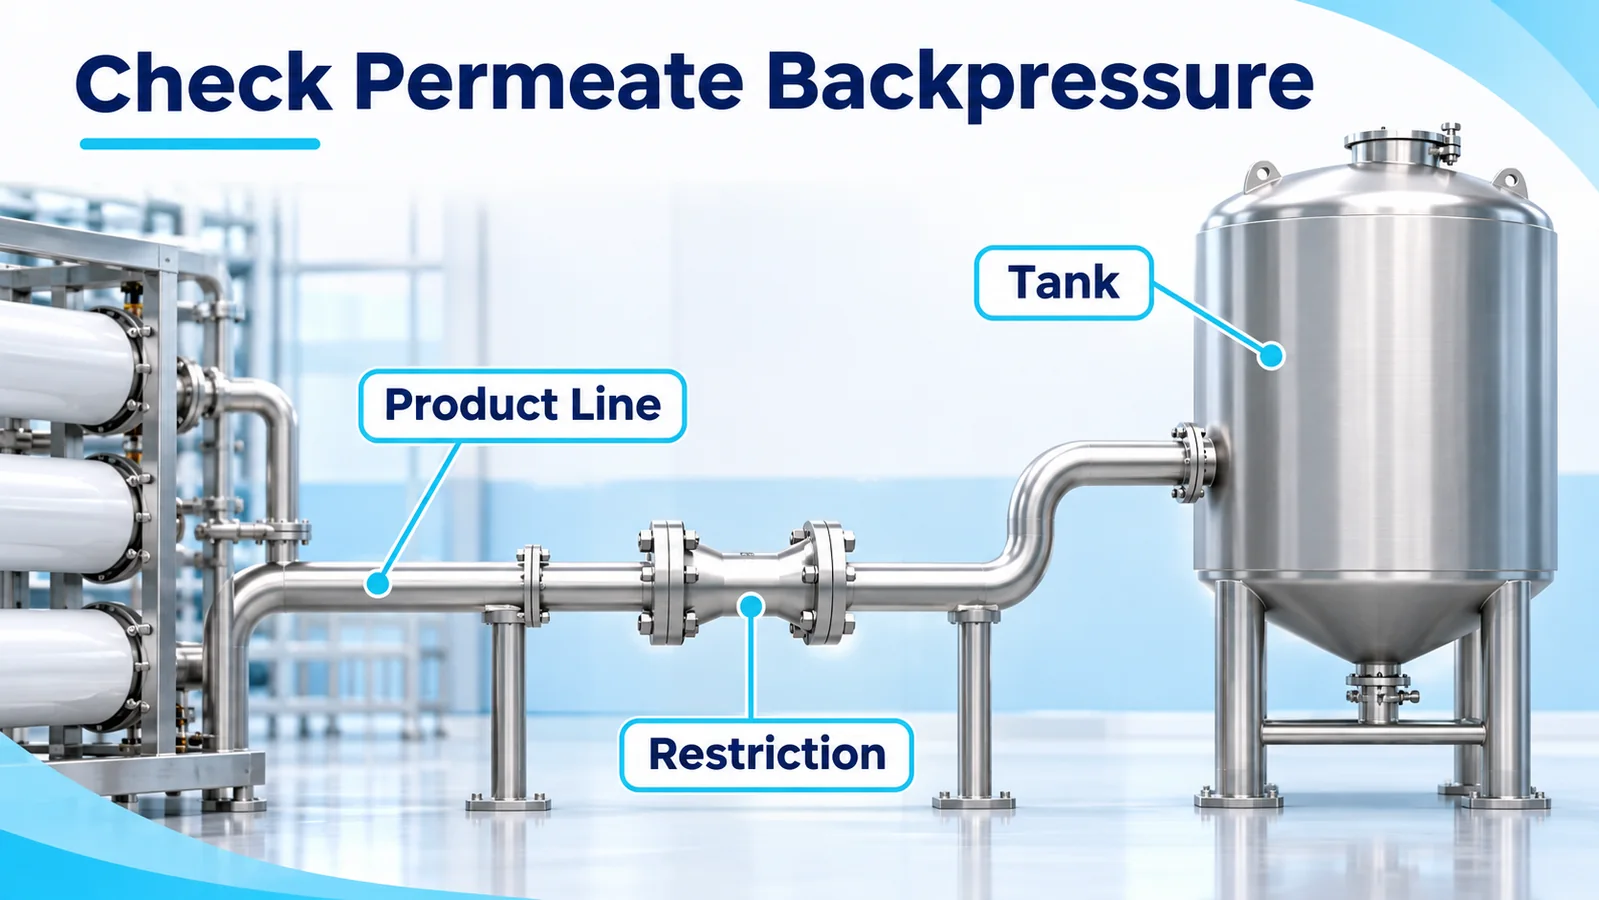
Pressure on the product side opposes the hydraulic force moving water through the membrane. For a simple stage estimate, average the feed and concentrate gauge pressures and subtract permeate gauge pressure. Then subtract the estimated osmotic pressure difference across the membrane to obtain approximate net driving pressure (NDP). Osmotic pressure depends on water composition and concentration. The actual driving pressure varies along the stage because pressure falls and the feed becomes more concentrated as permeate leaves.
Consider an illustrative single-stage brackish-water RO skid at steady operation. Its pressure readings are 12.0 bar(g) at the feed, 11.4 bar(g) at the concentrate, and 1.0 bar(g) at the permeate. Assume an effective osmotic pressure difference of 2.0 bar for this snapshot. The following calculations use pressure differences in bar.
| Quantity | Perhitungan | Hasil |
|---|---|---|
| Feed-channel DP | 12.0 − 11.4 | 0.6 bar |
| Estimated mean feed-side hydraulic pressure | (12.0 + 11.4) ÷ 2 | 11.7 bar(g) |
| Estimated hydraulic pressure across the membrane | 11.7 − 1.0 | 10.7 bar |
| Estimated net driving pressure | 10.7 − 2.0 | 8.7 bar |
If permeate pressure rises to 1.8 bar(g) in a second snapshot with the same feed and concentrate readings and the same assumed osmotic pressure difference, feed-channel DP stays at 0.6 bar and estimated NDP falls to 7.9 bar. A filling tank, higher header pressure or a restriction on the product side could explain the rise. Compare the actual measurements and operating state before changing the feed setpoint. The example values illustrate the arithmetic. Use the membrane supplier’s design or normalization method for actual performance calculations. FilmTec technical manual, §3.12.2 and §5.6.6
Shutdown needs a separate check. Feed and concentrate pressure can decay quickly when the pump stops while a pressurized product header or elevated tank retains pressure. Confirm the membrane’s allowable reverse pressure and the approved protective valve arrangement for the specific skid. Ask the OEM how the system keeps permeate pressure within the approved differential relative to the feed and concentrate when power is lost. Verify that behavior under the OEM’s approved test procedure. FilmTec shutdown guidance, §3.14.2 and §5.4
How do you compare RO pressure trends over time?
Record a stable commissioning baseline with the relevant train configuration. Keep timestamps and data-quality flags for pressure, feed temperature, flows and conductivity. At a minimum, preserve each active stage’s feed, concentrate and permeate readings together with the flows and water-quality data required by the OEM’s normalization method. Note which trains or vessels are online and retain operating events such as a valve change, flush, chemical clean or cartridge replacement.
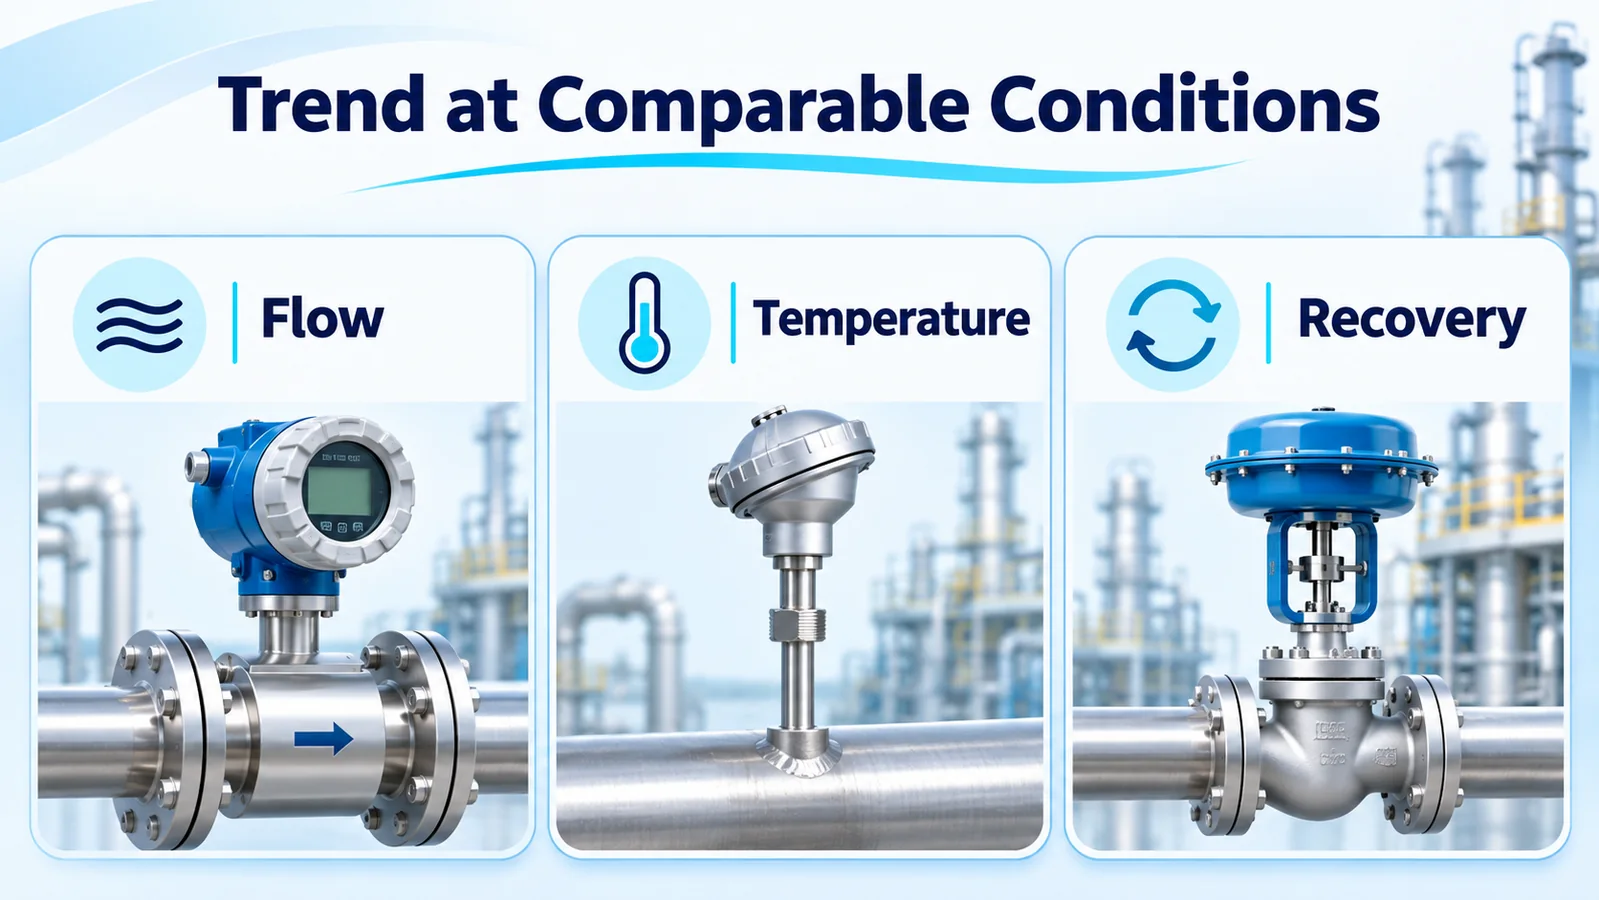
Compare raw stage DP at similar flow, recovery and temperature, or use the membrane supplier’s pressure-drop normalization if the installation and available data support it. Calculate recovery from the corresponding permeate and feed flows on the same system or stage boundary. For membrane performance, normalize permeate flow and salt passage to a defined reference using the OEM method. The reference may be stable commissioning data or the design condition, depending on whether you are tracking changes or checking against design. Keep the raw values visible for diagnosing operating events and for checking instantaneous limits. Toray RO operation and normalization guidance, TMM-230
For example, if product flow falls on a colder day and normalized flow stays near baseline, first review the measured temperature and the normalization inputs. If stage DP rises at comparable conditions, check the tap readings, flow and upstream filtration. A declining normalized permeate flow with increasing stage DP gives more reason to investigate the affected stage than either reading alone. A step change just after instrument replacement calls for checking the new pressure range, reference and scaling against the old channel before interpreting the trend.
Which instruments fit feed, permeate and differential pressure?
Use a single-point transmitter for each line pressure you need to display or control. For a DP trend, either subtract two synchronized single-point readings in the PLC or use a liquid-compatible two-port DP instrument. In both cases the expected stage loss, allowable measurement error and highest line pressure drive the selection. The pressure reference and scaling should be explicit on the drawing and in the controller. Gauge, absolute and differential pressure guide
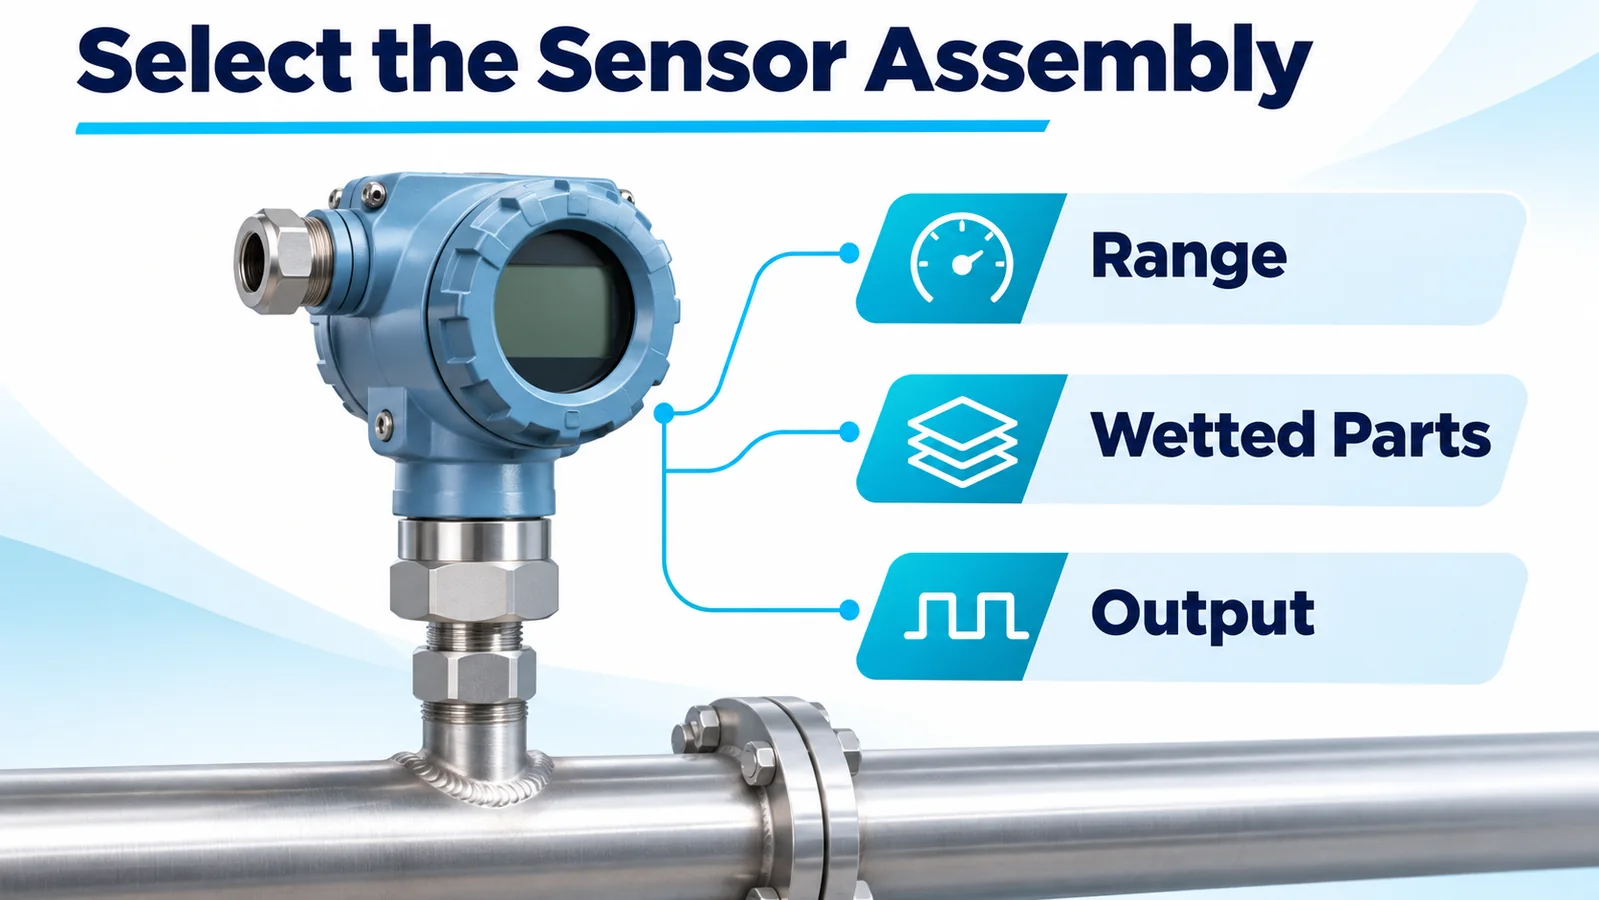
Wpck07 is a finished diffused silicon pressure transmitter. Evaluate an appropriate single-point gauge version for feed, concentrate or permeate service. Current, voltage and digital options are listed for the family. Confirm the ordered range, pressure reference, process connection, supply and output before assigning it to a PLC input. Size the permeate range around its own operating and transient conditions. A feed-range instrument may have insufficient resolution or accuracy for a smaller permeate reading. Winsen WPCK07 product page
Wpak67 is a two-port, oil-filled differential pressure sensing core with stainless steel isolation diaphragms and a millivolt bridge output. An OEM integrating it must engineer the pressure-rated body and process connections, bridge excitation, signal conditioning, compensation and calibration. A skid that requires a packaged DP transmitter and standard PLC signal needs a completed, qualified instrument. Confirm the exact core configuration with Winsen before engineering the assembly. Winsen WPAK67 product page
Check the allowable common static line pressure, accuracy at that line pressure, and one-sided overload or reverse differential for start-up, shutdown and isolation. In the worked example, the instrument measures a 0.6 bar difference while both ports see pressures around 12 bar(g). Those conditions impose different requirements. Confirm compatibility of every wetted part with feed, concentrate and the cleaning regime, including seals, ports and manifold materials. Obtain any project-required contact approvals for the complete assembly. Rosemount DP instrument reference manual
For an illustrative PLC subtraction, two 0–25 bar sensors each specified at ±0.5% of full scale have individual limits of ±0.125 bar under the stated specification conditions. Their errors can add to ±0.25 bar on the calculated difference before installation or timing effects. Judge that limit against the smallest change the alarm or maintenance trend needs to detect. Pressure sensor accuracy guide
What should you check before commissioning RO pressure alarms?
Document the allowed membrane feed pressure, feed-channel pressure drop per element and per vessel, and reverse permeate pressure for the installed membrane and skid. Also check the ratings of the vessels, piping, instruments and accessories. Set protection and operating alarms using the approved OEM limits, including the measurement uncertainty and the response needed for transients. A maintenance threshold based on a normalized trend serves a different purpose from a hard protective limit. Toray start-up and operating guidance, TMM-220 and TMM-230
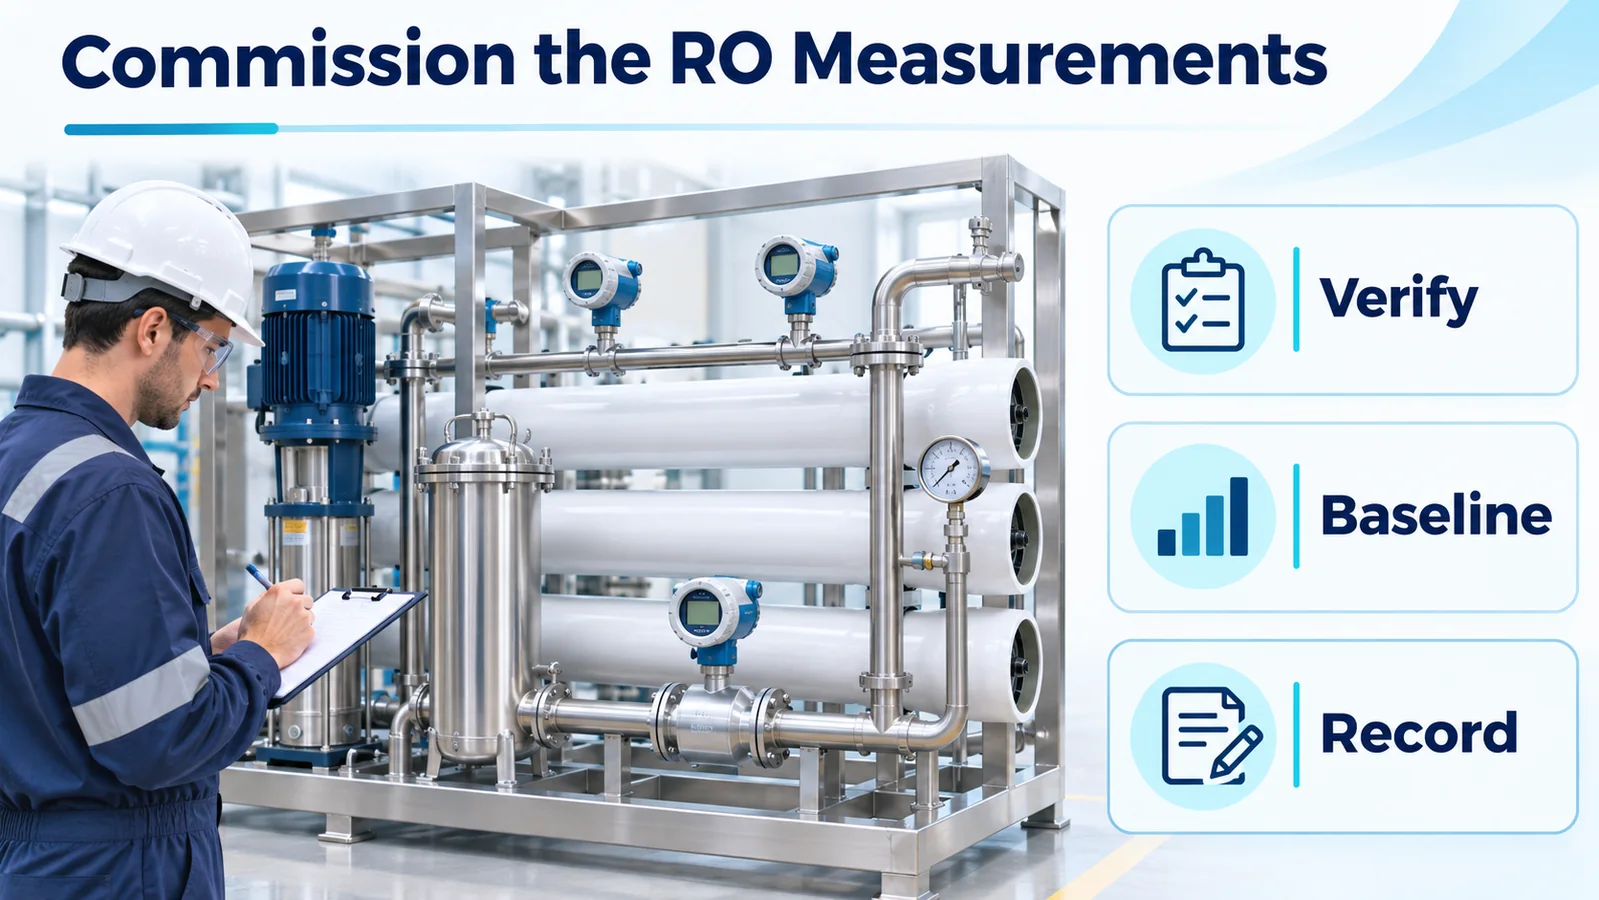
- Verify every tag against the physical tap, pressure reference, calibrated span and engineering units. Confirm high and low sides on the DP assembly. Identify any elevation difference or trapped gas that could bias the reading.
- Under the site’s approved isolation and depressurization procedure, check the installation and compare the instruments with a suitable reference. Use the manufacturer’s approved zero and equalization method for the configured DP assembly.
- Check PLC scaling and input diagnostics. Invalidate calculated DP if either pressure value is stale or faulty. Verify alarm and trip behavior through an approved simulation or test that stays within the equipment limits.
- Record stable production readings after commissioning and retain separate records for start-up, flush and shutdown. Verify that filtering and historian sampling preserve the events the controls need to detect.
Pertanyaan yang sering diajukan
Where should the concentrate pressure sensor go?
Place it at the stage outlet on the membrane side of the concentrate control valve. In that position, subtracting the outlet pressure from feed pressure captures the loss between the stage taps.
Is membrane pressure drop the same as net driving pressure?
Feed-channel pressure drop is feed pressure minus concentrate pressure. Net driving pressure estimates the hydraulic pressure difference across the membrane after subtracting the osmotic pressure difference.
Can I calculate RO differential pressure with two gauge transmitters?
Yes. Use synchronized readings with matching units and reference, and verify that combined error is small relative to the DP change that matters. A suitable dedicated DP instrument can measure smaller changes if it meets the static pressure and overload requirements.
What pressure drop should trigger cleaning?
Use the normalized trend and cleaning criteria for the installed membrane and system. Check that the change persists at comparable conditions and that the instruments are working before starting the OEM’s prescribed cleaning process.
